Server Management
From the NST dashboard, a user can access the server supervision view by clicking on the Servers tab.
An example of server view is shown below:
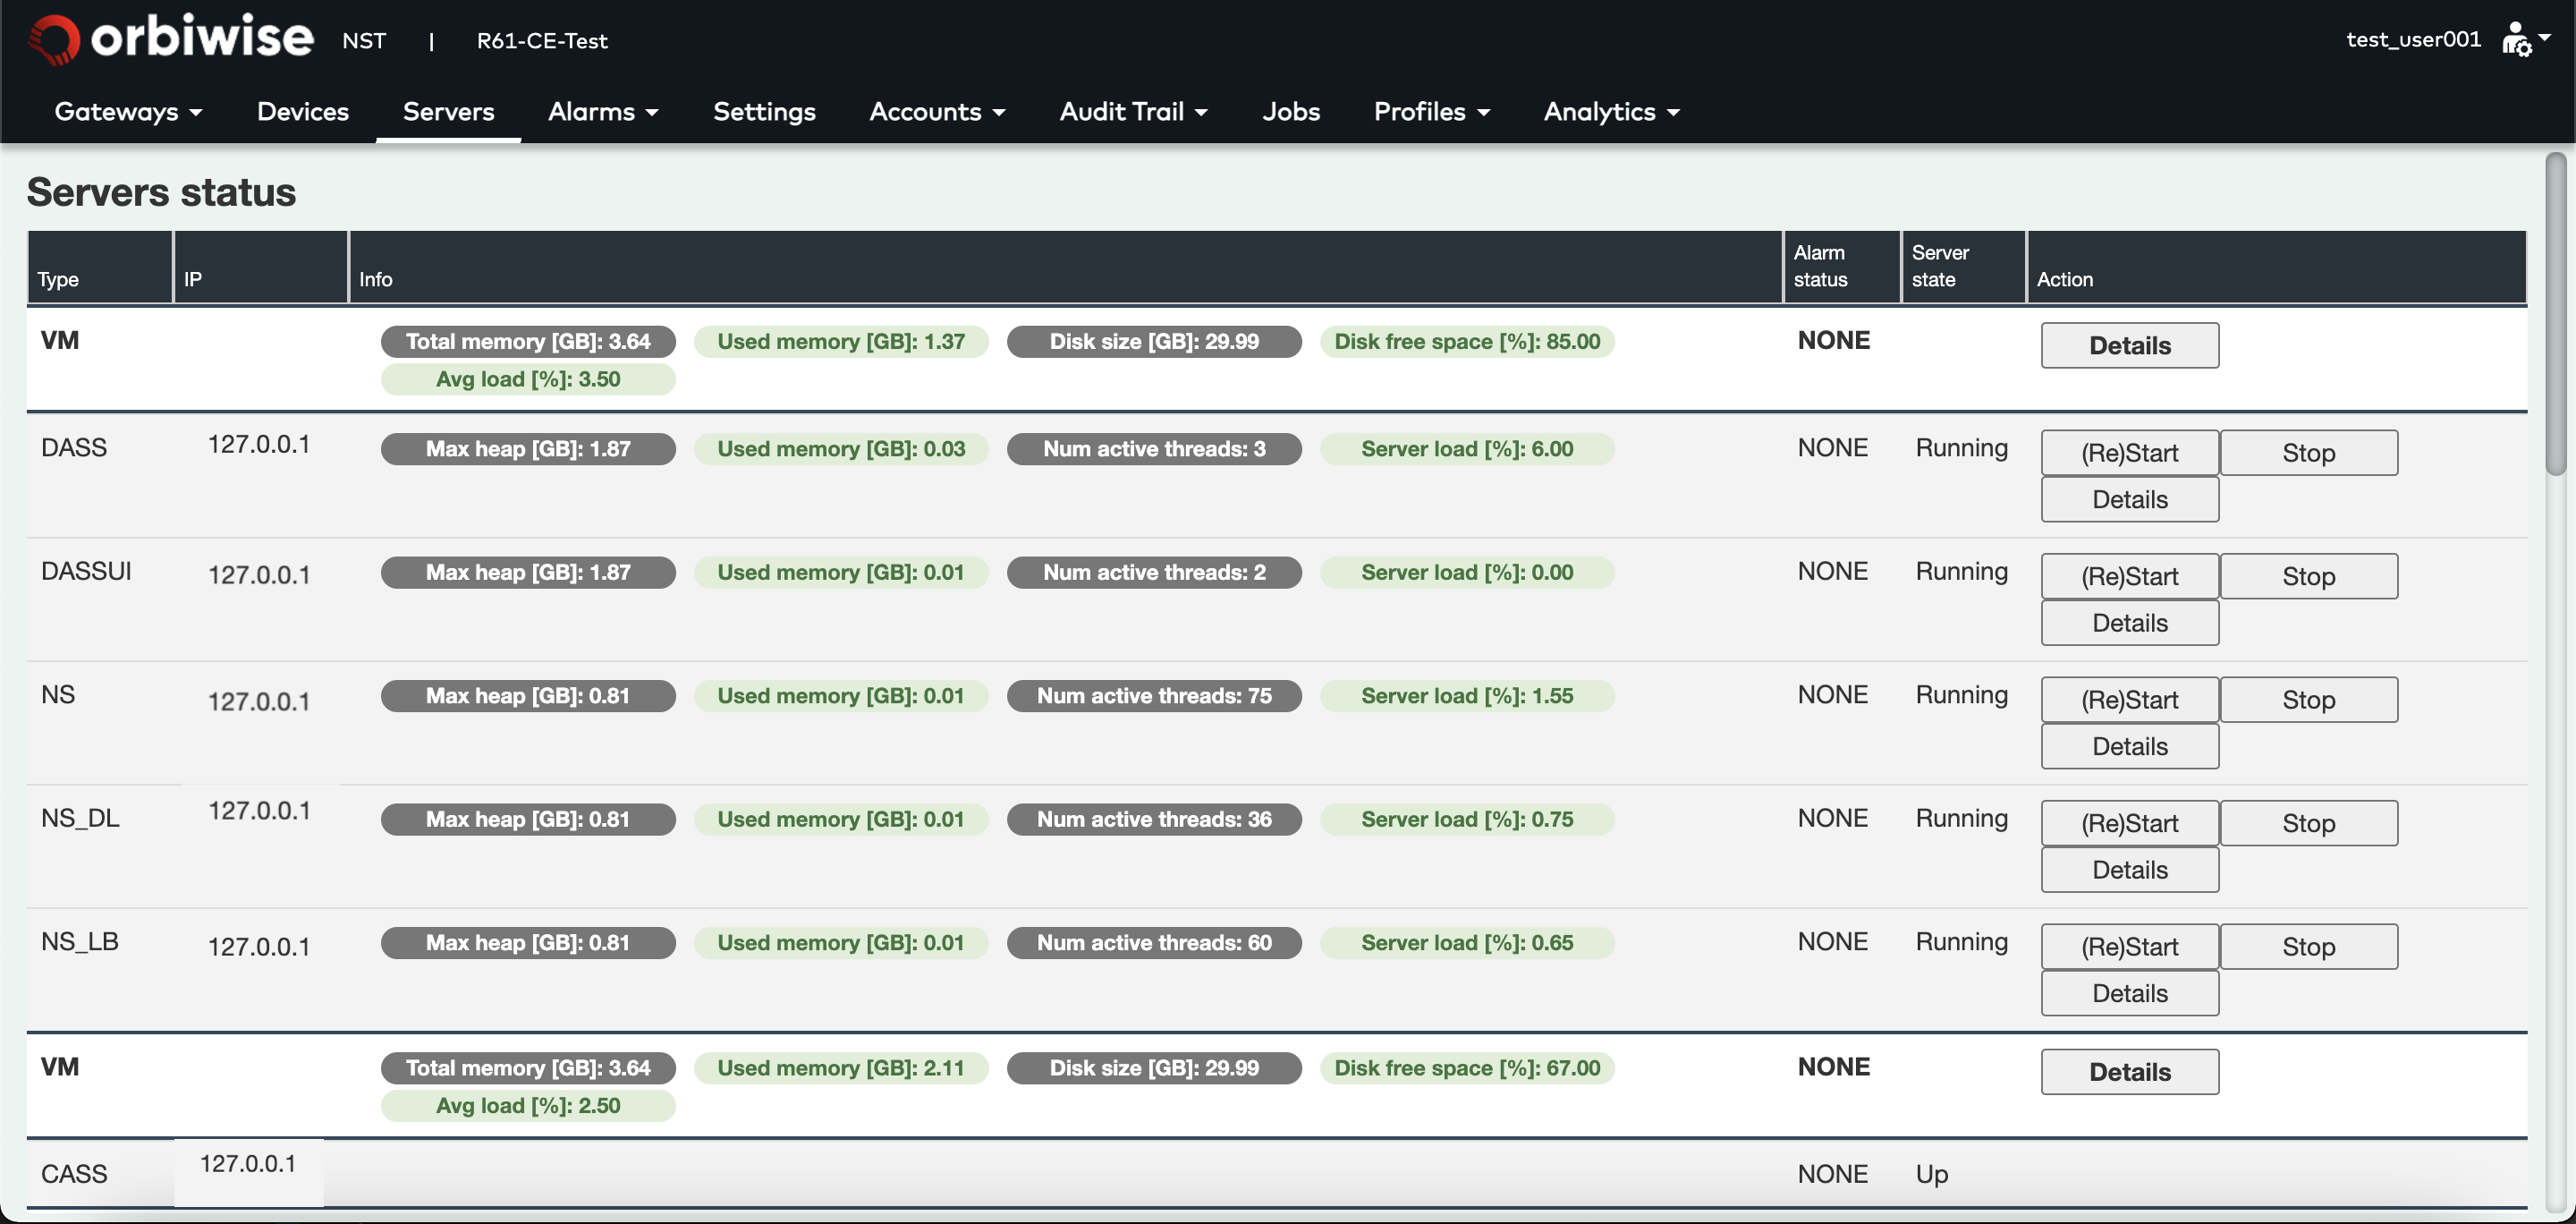
This view shows a simple deployment of the OrbiWAN solution on a single VM. Below one VM row are listed all the functional servers that are running on it.
Below image shows that some servers are highlighted in orange or red. If the server is in Orange, it means that there is a minor alarm that has been raised.
In the example, the DASS-UI server is in orange. The VM is red, meaning a major alarm is on going.
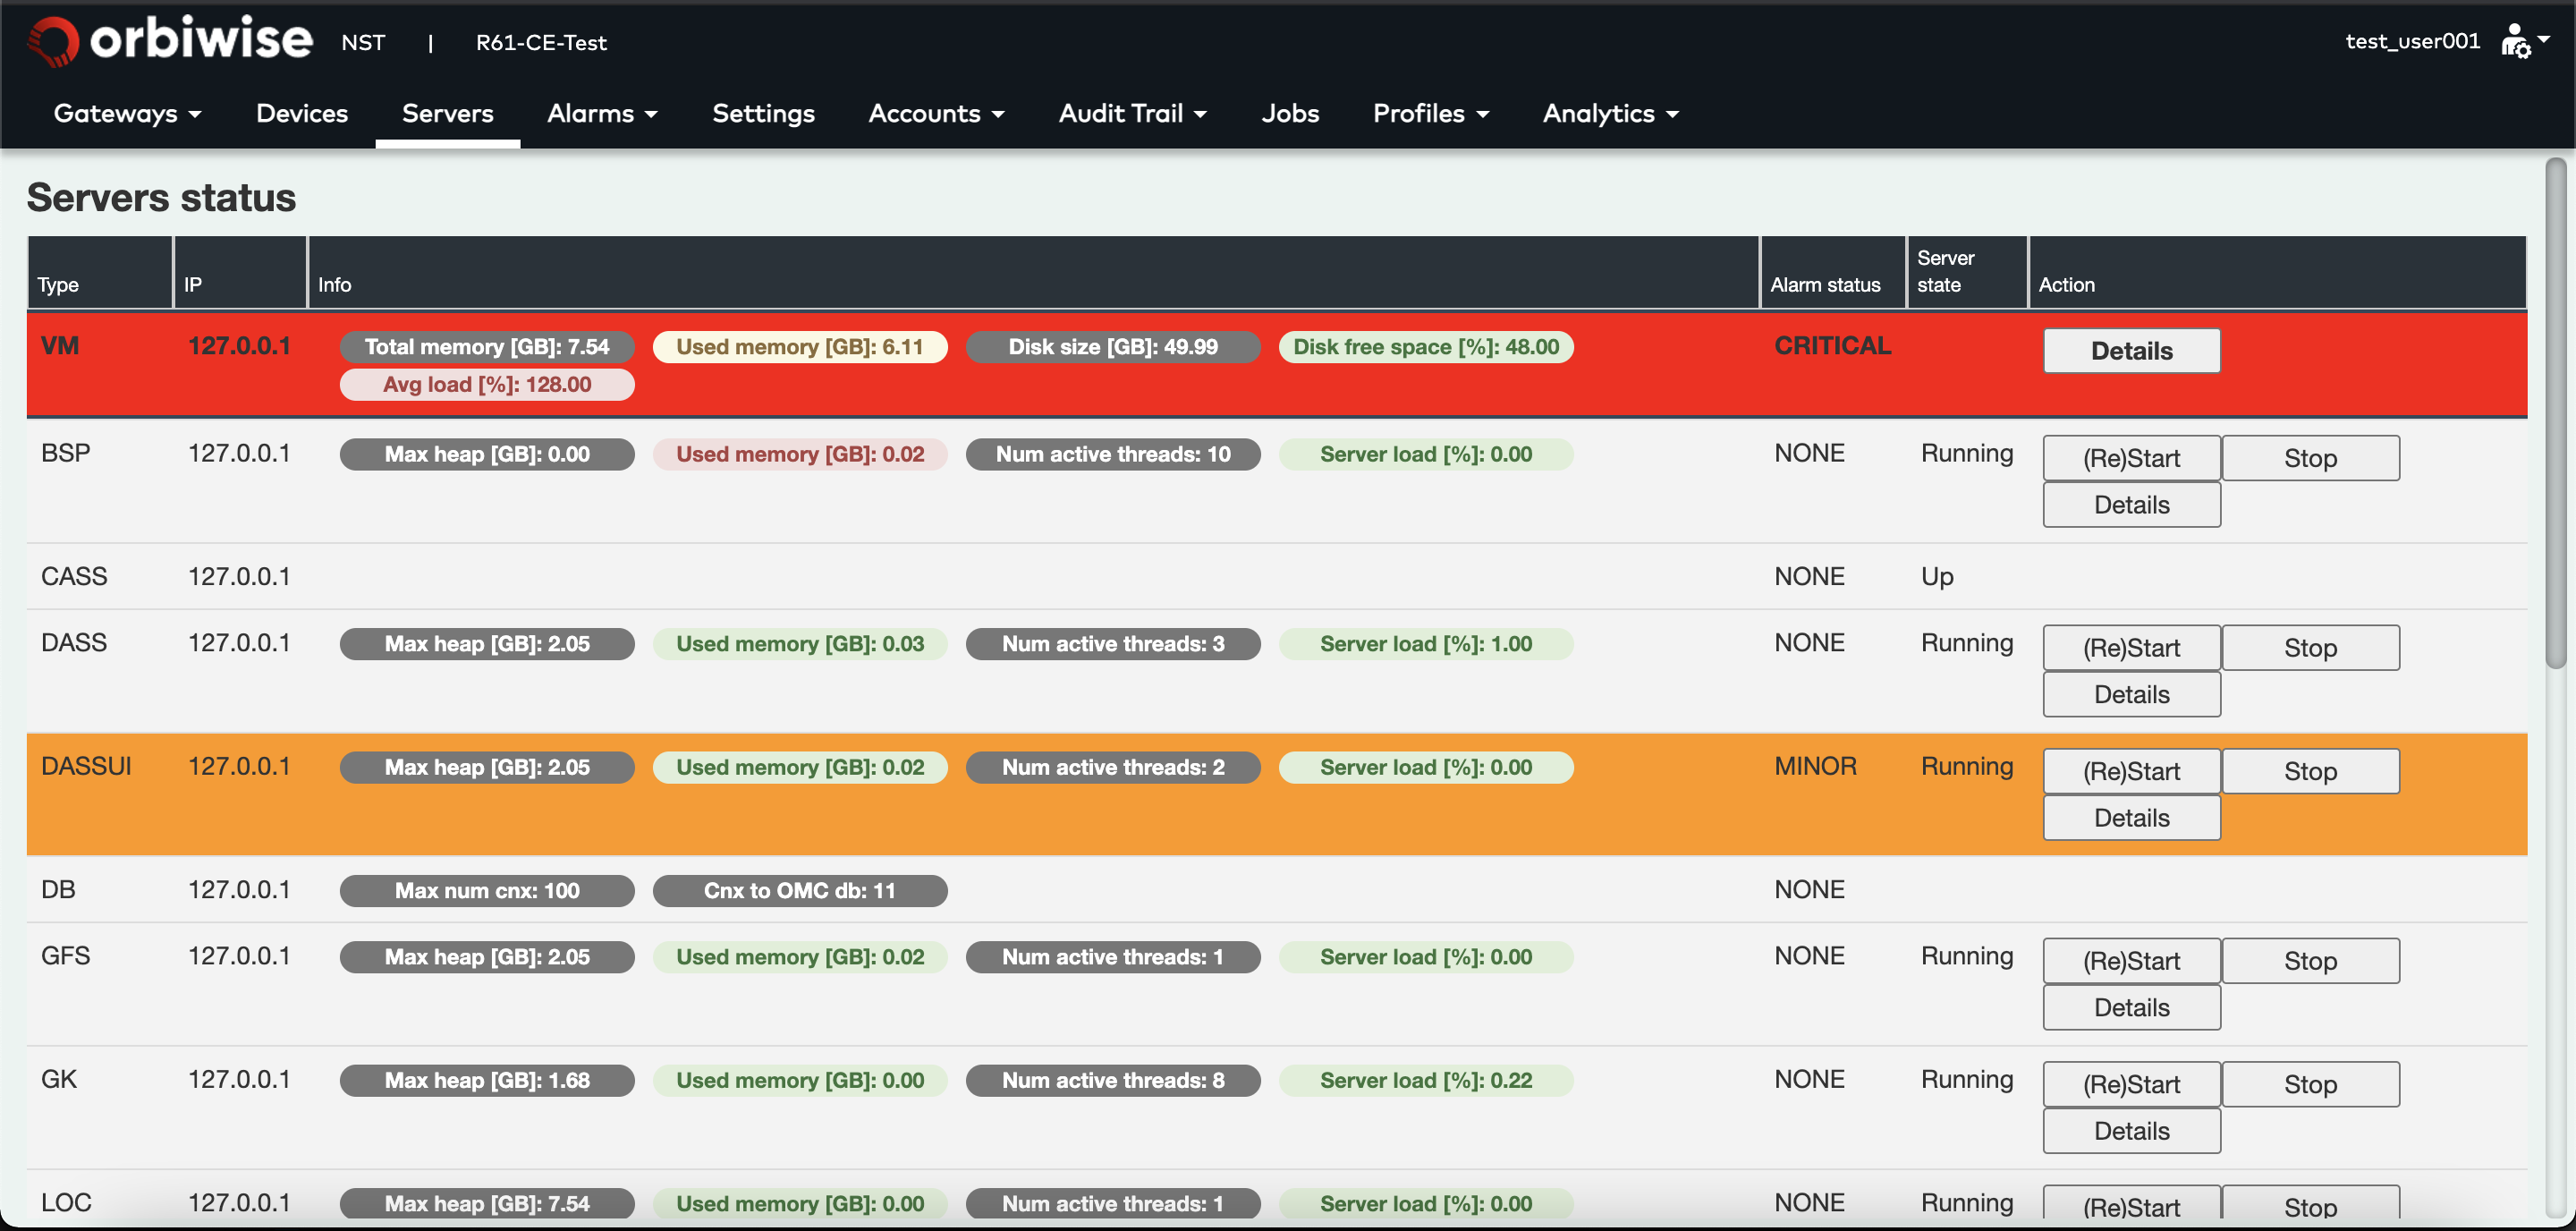
- Orange: For minor alarm.
- Red: For major alarm.
At any time, any server (owning the button) can be restarted by clicking on the (Re)Start button. It is safe to restart a server since all the states are stored in the database. Pressing the Stop button can stop a server.
On each server line different server status and health parameters are made available. Status (for all server except “CASS”) will be of the following:
- Running - This server is Running and it can be reached by OMC over health monitoring port.
- Stopped - This server was stopped on purpose. It must be restarted from the NST or through API (restarting from console will not introduce it back in the real-time path).
- NotResponding - The server could not be reached by OMC for at least 2 minutes.
- Rebooted - The server that was NotResponding was rebooted by OMC.
- NotRebooting - The reboot operation of a NotResponding server resulted in failure.
- Unavailable - The server was rebooted by OMC, but didn’t come up after 30 seconds.
For “CASS” (Cassandra database node) the status will be one of the following: • Up • Down
If an issue on a server is detected the OMC will continue to monitor it for 2 minutes. After this time the state is set to NotResponding and a critical Red alarm “Server is unreachable by omserver” is raised. At this time the server is automatically rebooted (restarted).
This usually takes only few seconds so the NotResponding state is typically not seen on the UI server view because this page is only updated every 30 seconds.
After reboot, when the server has been observed to be alive again the state is moved back to Running. At this time the “Server is unreachable by omserver” alarm is closed again and another information (yellow) alarm “Server was unreachable by omServer and has been restarted successfully” is created and left active (for the user to manually close).
If this also happed within in few seconds it is possible that the change of state is not seen on the UI, however the alarm(s) will have been created to indicate that the event happened.
If the server cannot be rebooted (e.g. the installation has become corrupt), the state becomes NotRebooting and the “Server is unreachable by omserver” alarm remains active.
For VMs listed:
- The total memory available in GB.
- The used memory in GB.
- The disk space in GB.
- The remaining disk space in %.
- And the averaged load of the VM.
For functional servers listed:
- The max heap.
- Used heap
- The number of active threads, The CPU load of the server.
Whenever one of these server health parameters is becoming critical, the background color will change and an alarm will be raised.
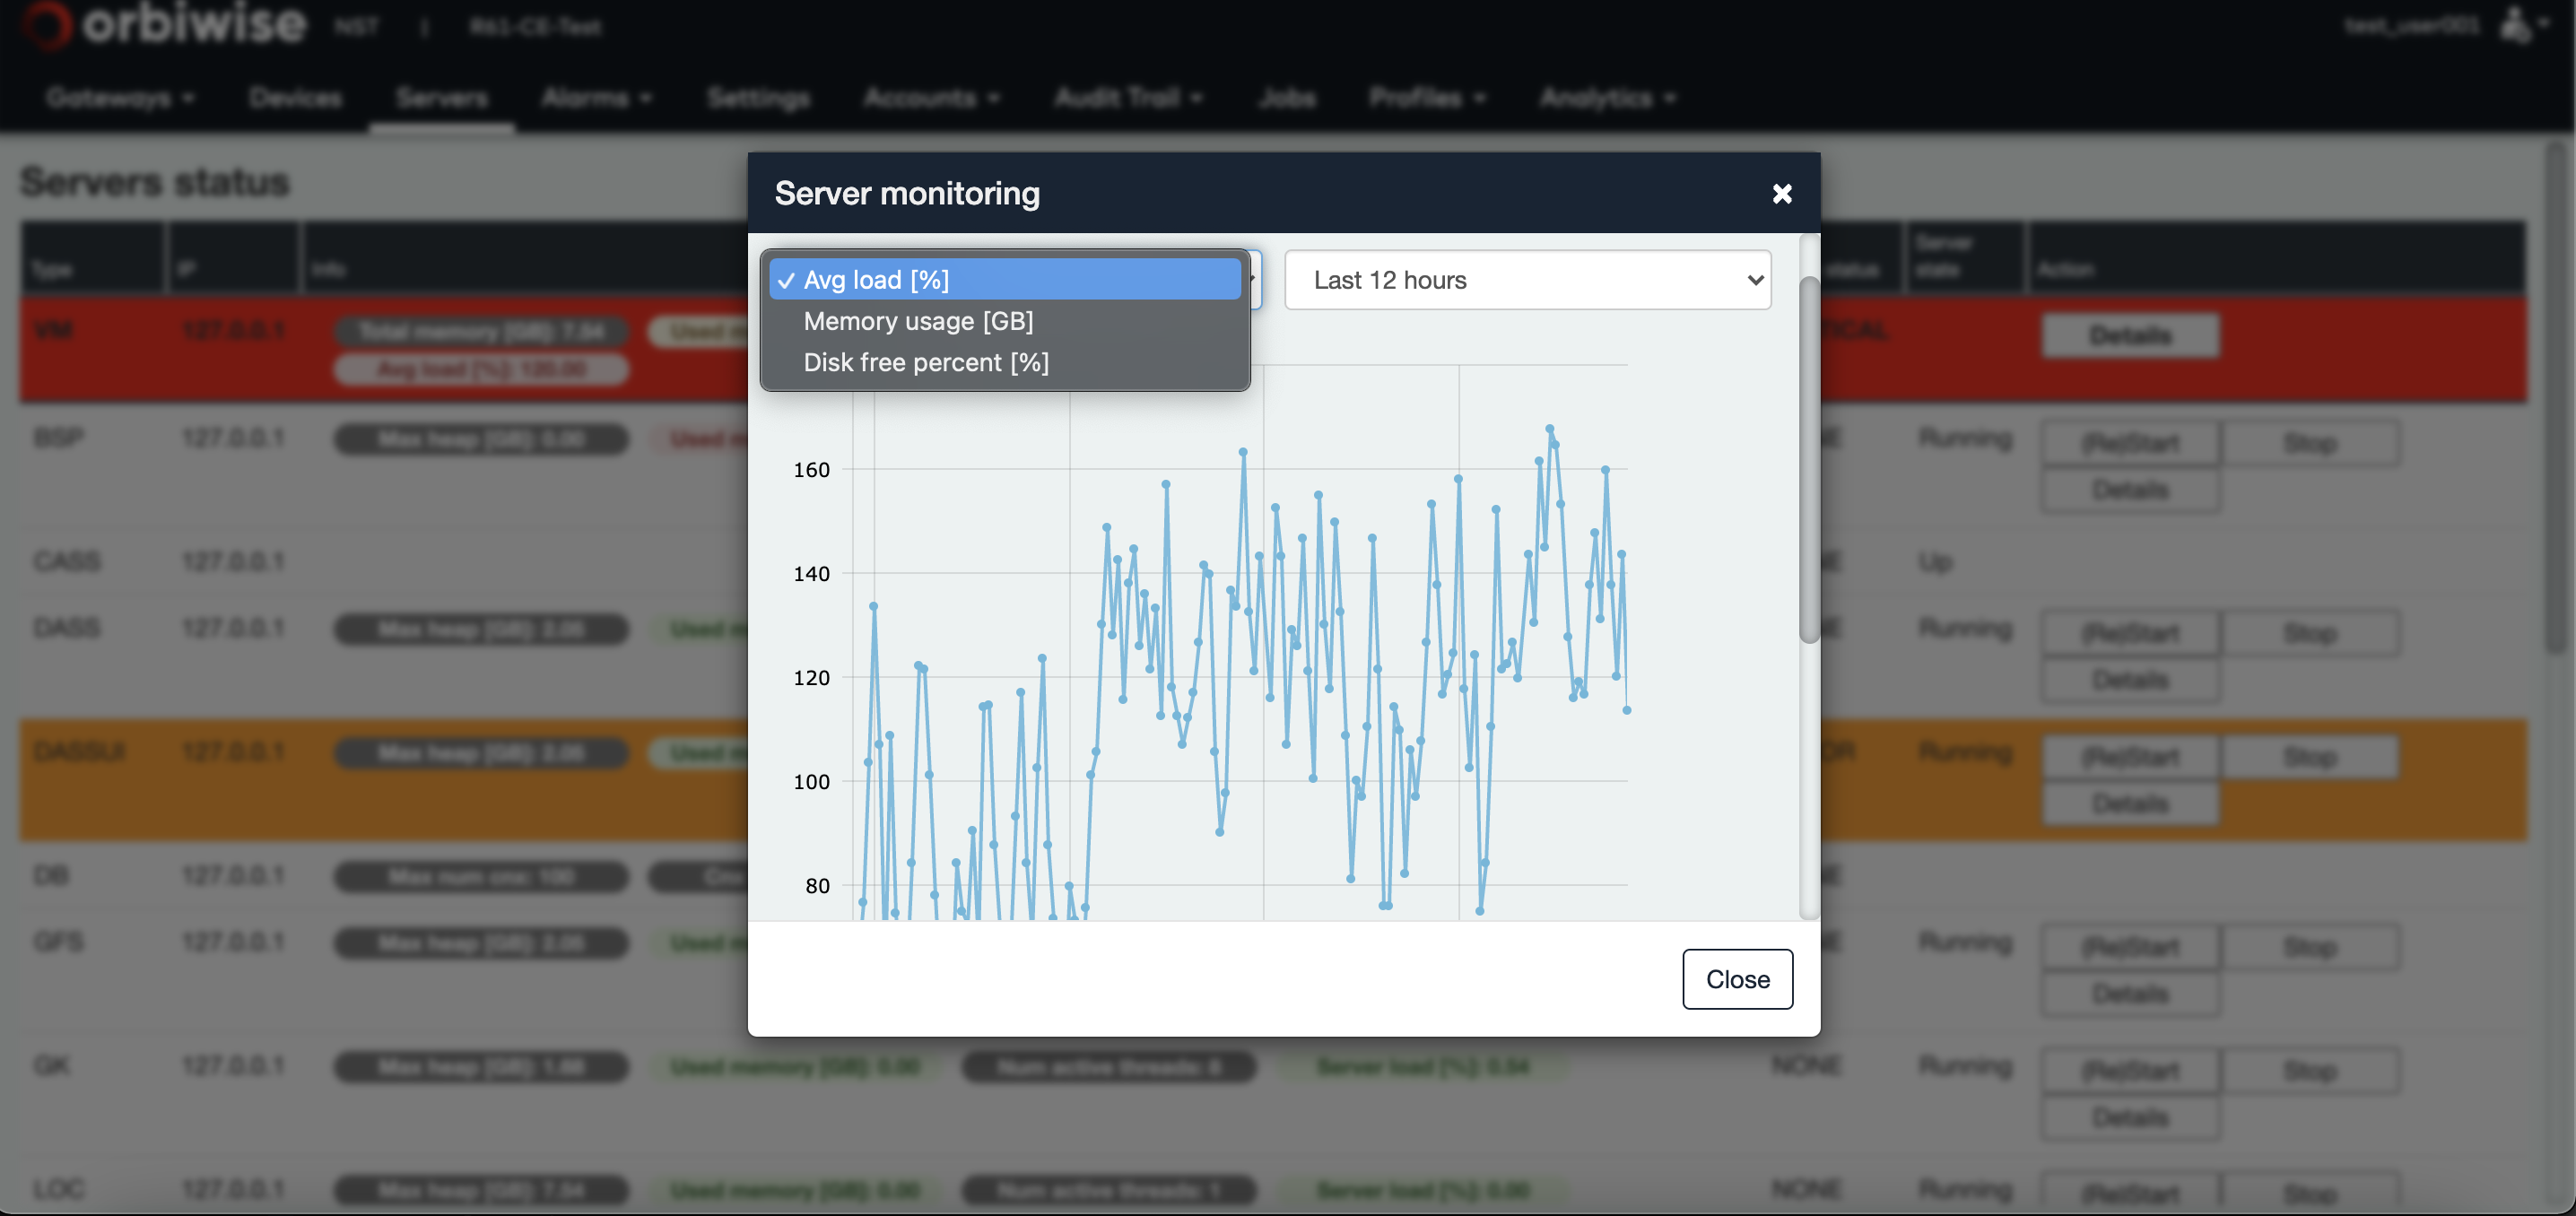
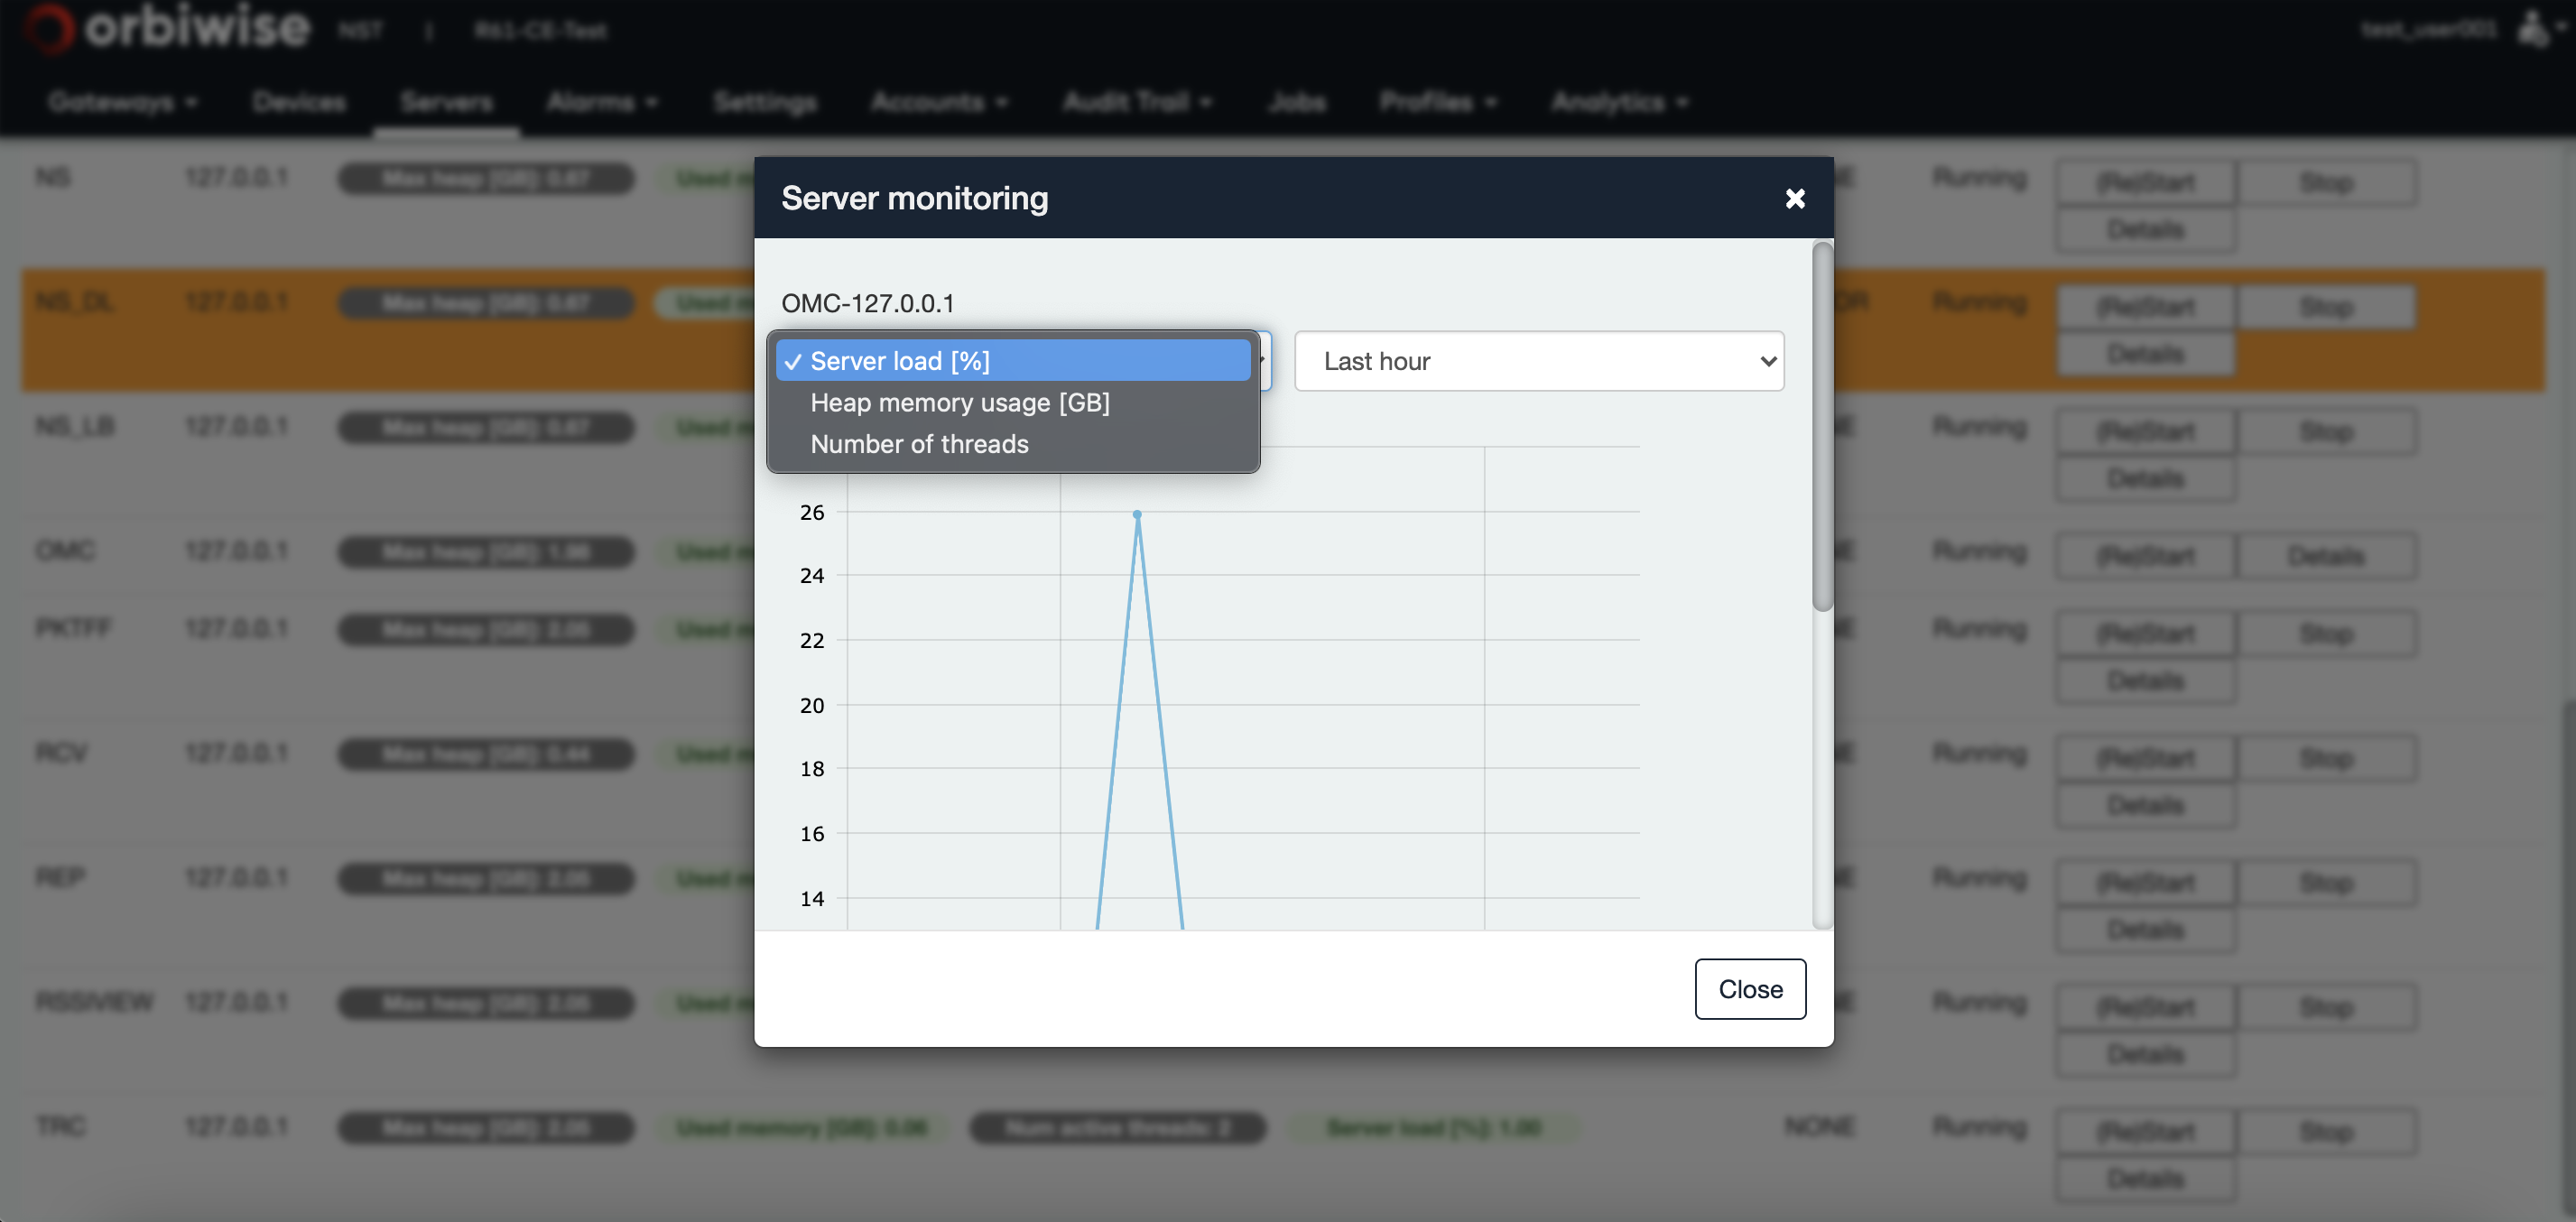
By clicking the details button of a server, a timeline evolution of some server health parameters will be displayed.
For virtual machines, the average load, the memory usage and the disk free space can be displayed as shown in the figure below:
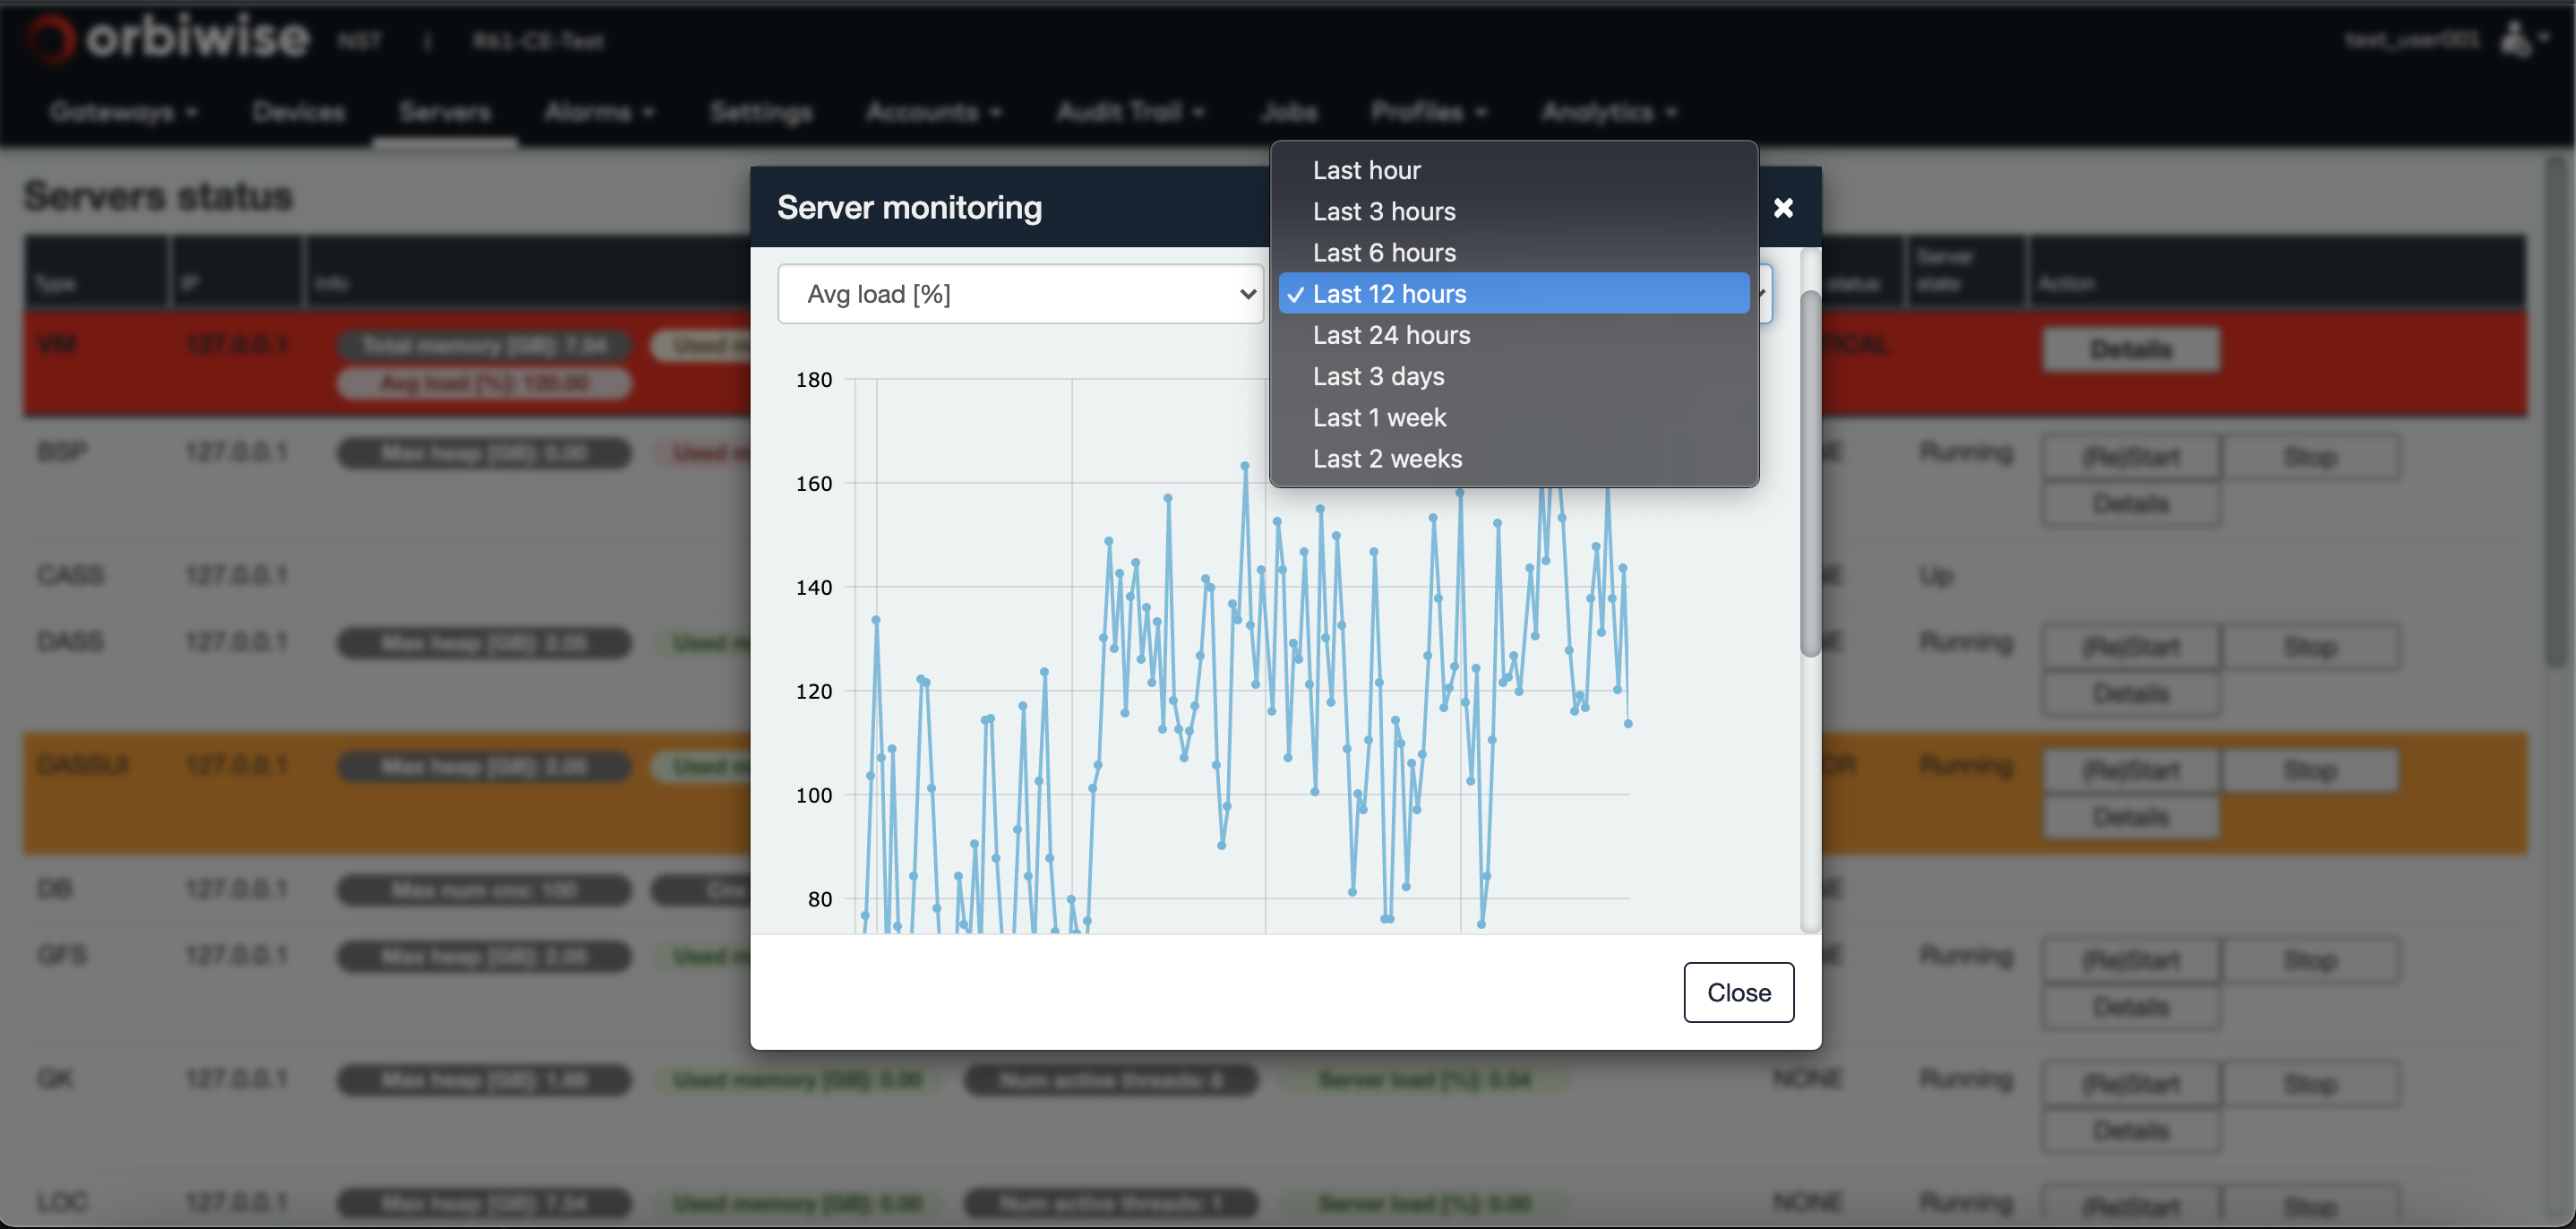
The timeline can be displayed for up to two weeks as shown in the figure shown below:
Same for servers: Timeline of CPU load, Heap memory size usage and Number of threads can be displayed as shown in the figure below:
Within the OrbiWAN solution, alarms can be raised by or for any components of the system. The Operation and Maintenance Center server manages the alarms.
Alarms that are on going or that have been raised then closed in the past can be displayed within the NST.
The Alarms tab is sub-divided in Servers alarms and Gateways alarms. These tabs give access to the on going alarms but also to the alarm history.
Note: The OMC server implements a SNMP interface, allowing the sending of a trap message at anytime an alarm is raised to a distant server. The MIB file for the interface is available for quick integration with a distant server.
Each alarm contains the following fields:
- The ID of the server (gateway for gateway view) that is related to the alarm. The ID identifying the server is made of the server type plus the local IP address of the VM on which the server is running.
- For gateway alarm view only, the gateway name.
- The device type that can be GTW or the name of the server (refer to section 6 for the list of the different servers used in the solution).
- The alarm type that describes the alarm.
- The status of the alarm.
- The start date of the alarm.
- The end date of the alarm.
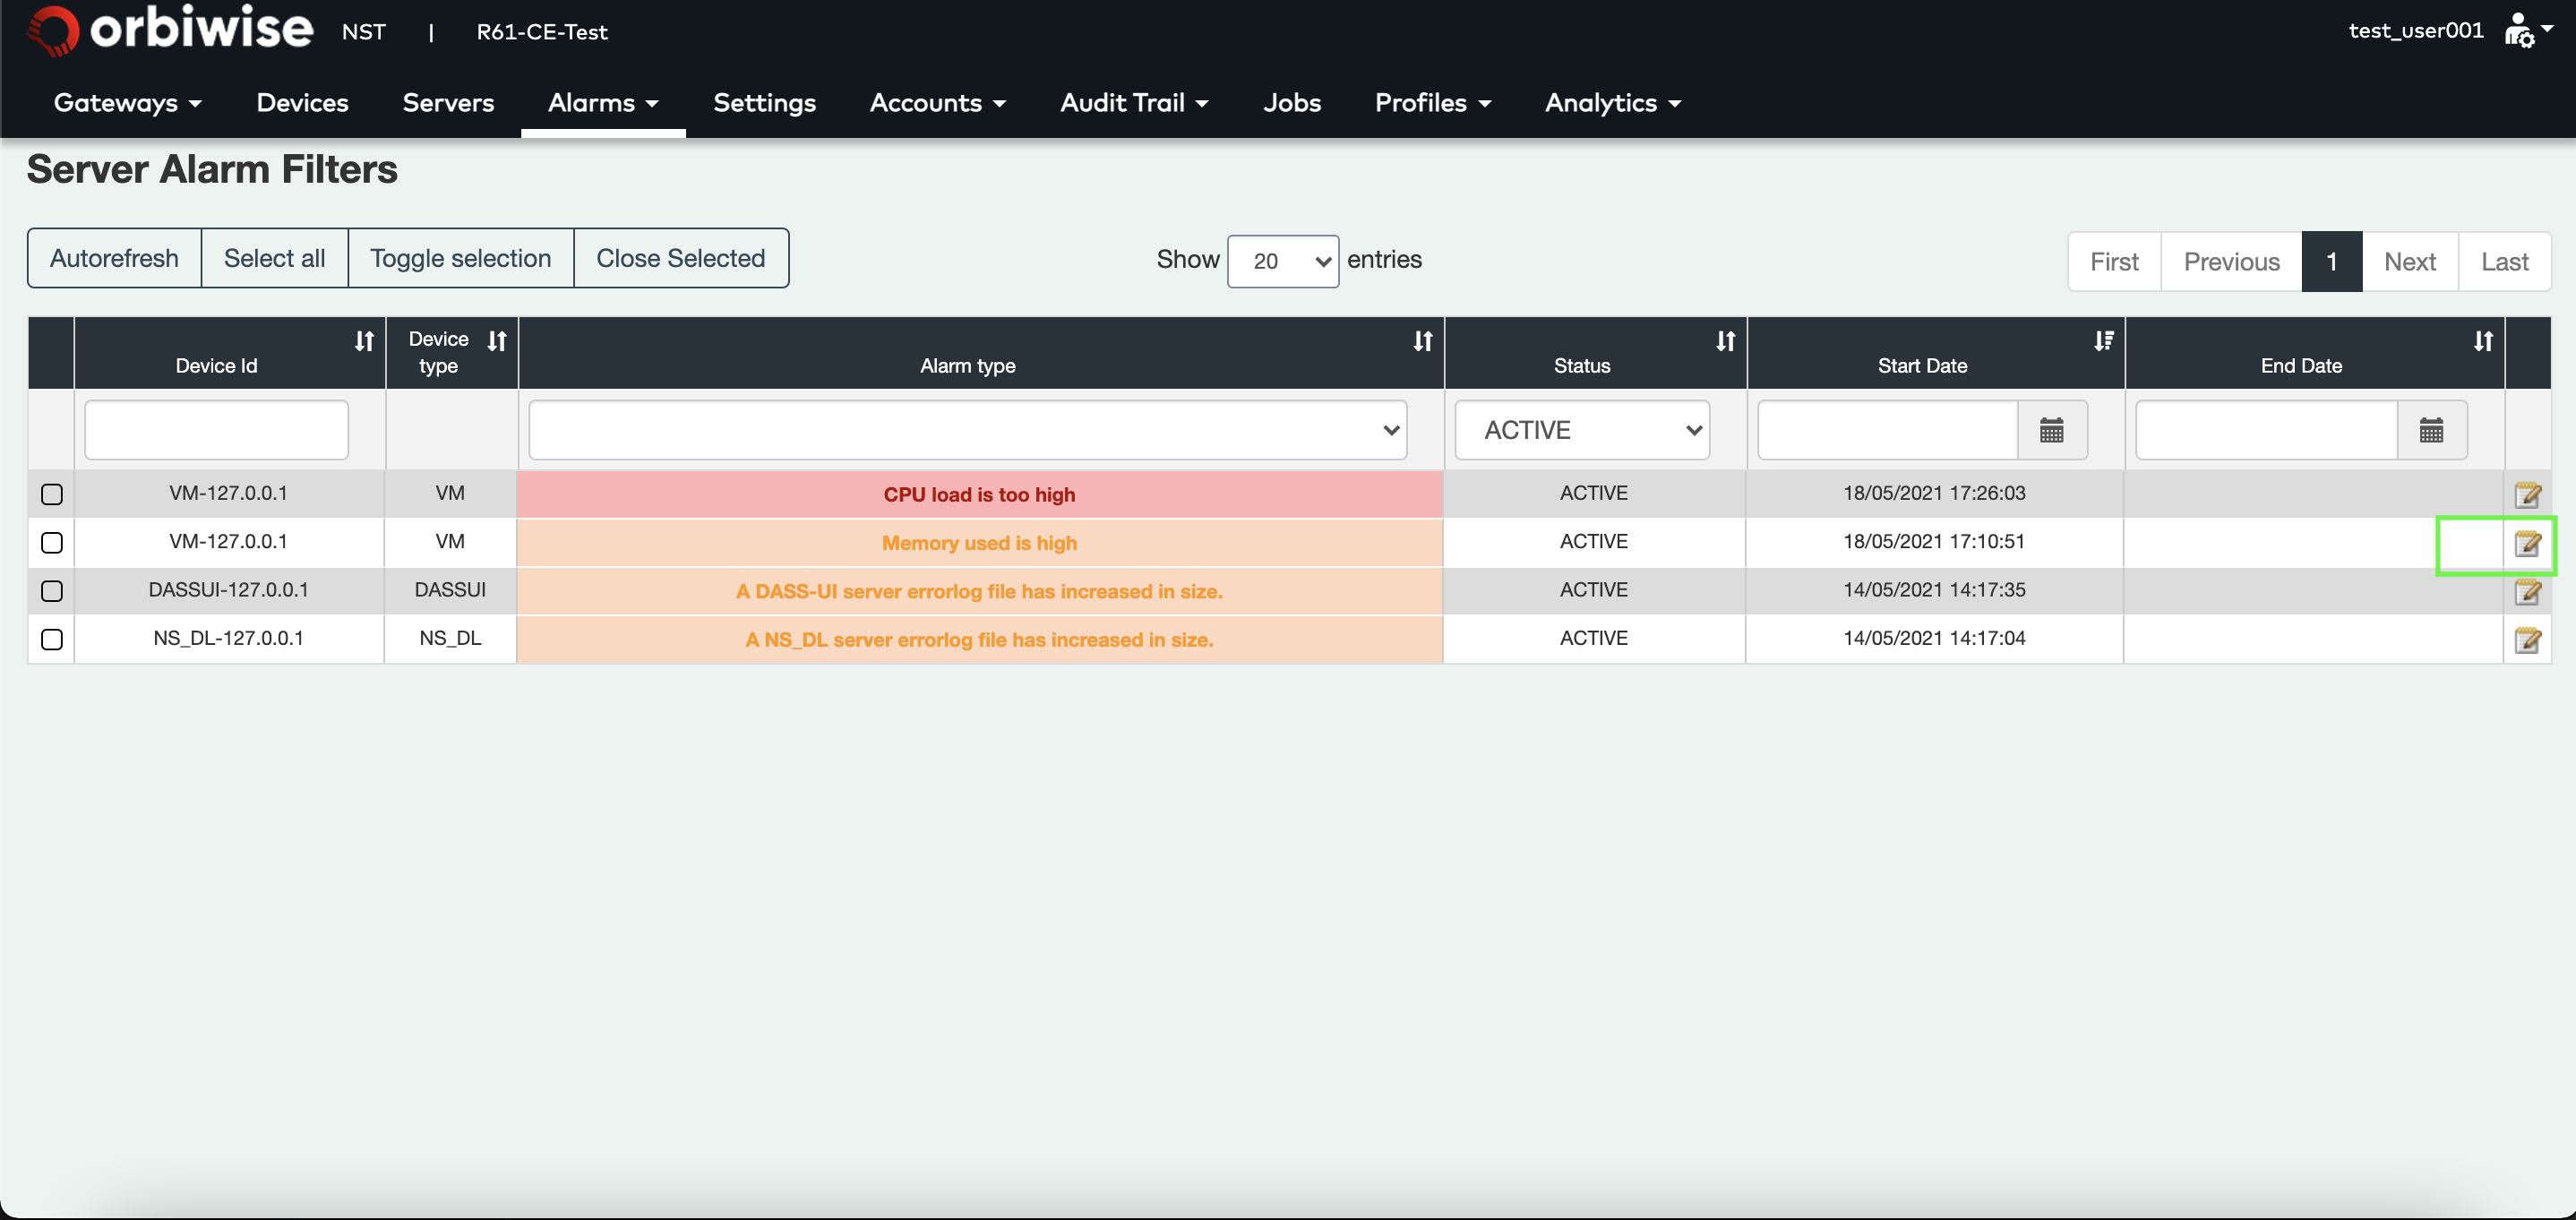
- A button to edit the alarm.
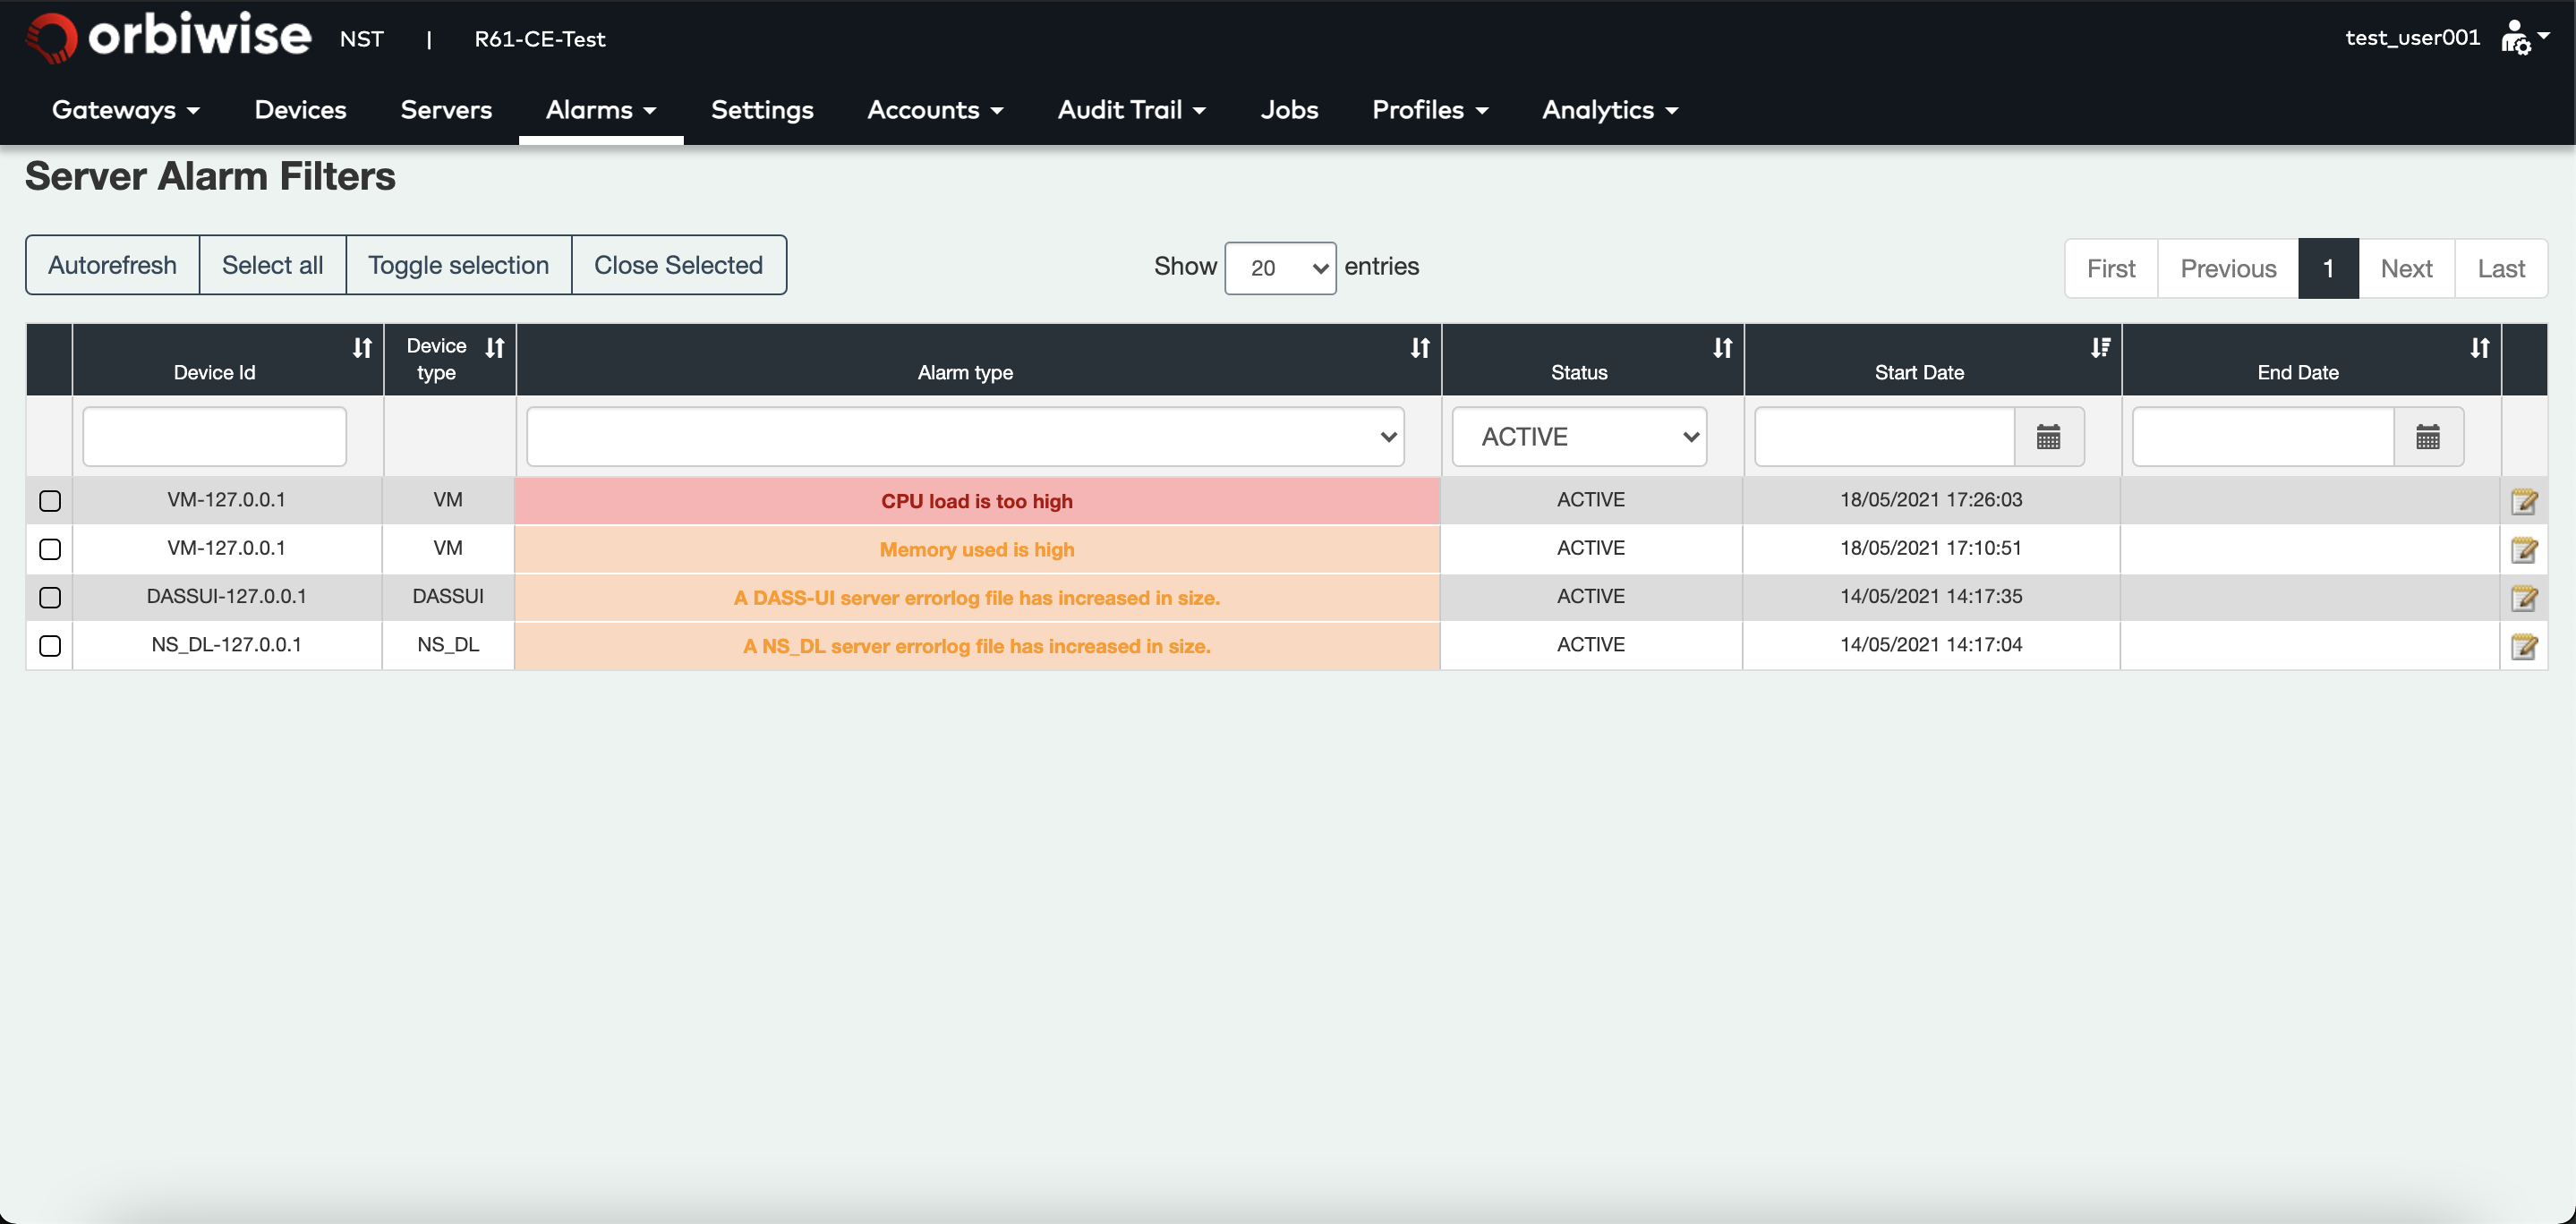
The color of the alarm frame is dependent of the alarm severity. Currently 3 severities are used in the system:
- Yellow for warning.
- Orange for minor alarm.
- Red for major alarm. Most of the alarms close themselves automatically. For example, if a gateway power supply alarm is raised, the alarm will be automatically closed whenever the gateway power supply is restored.
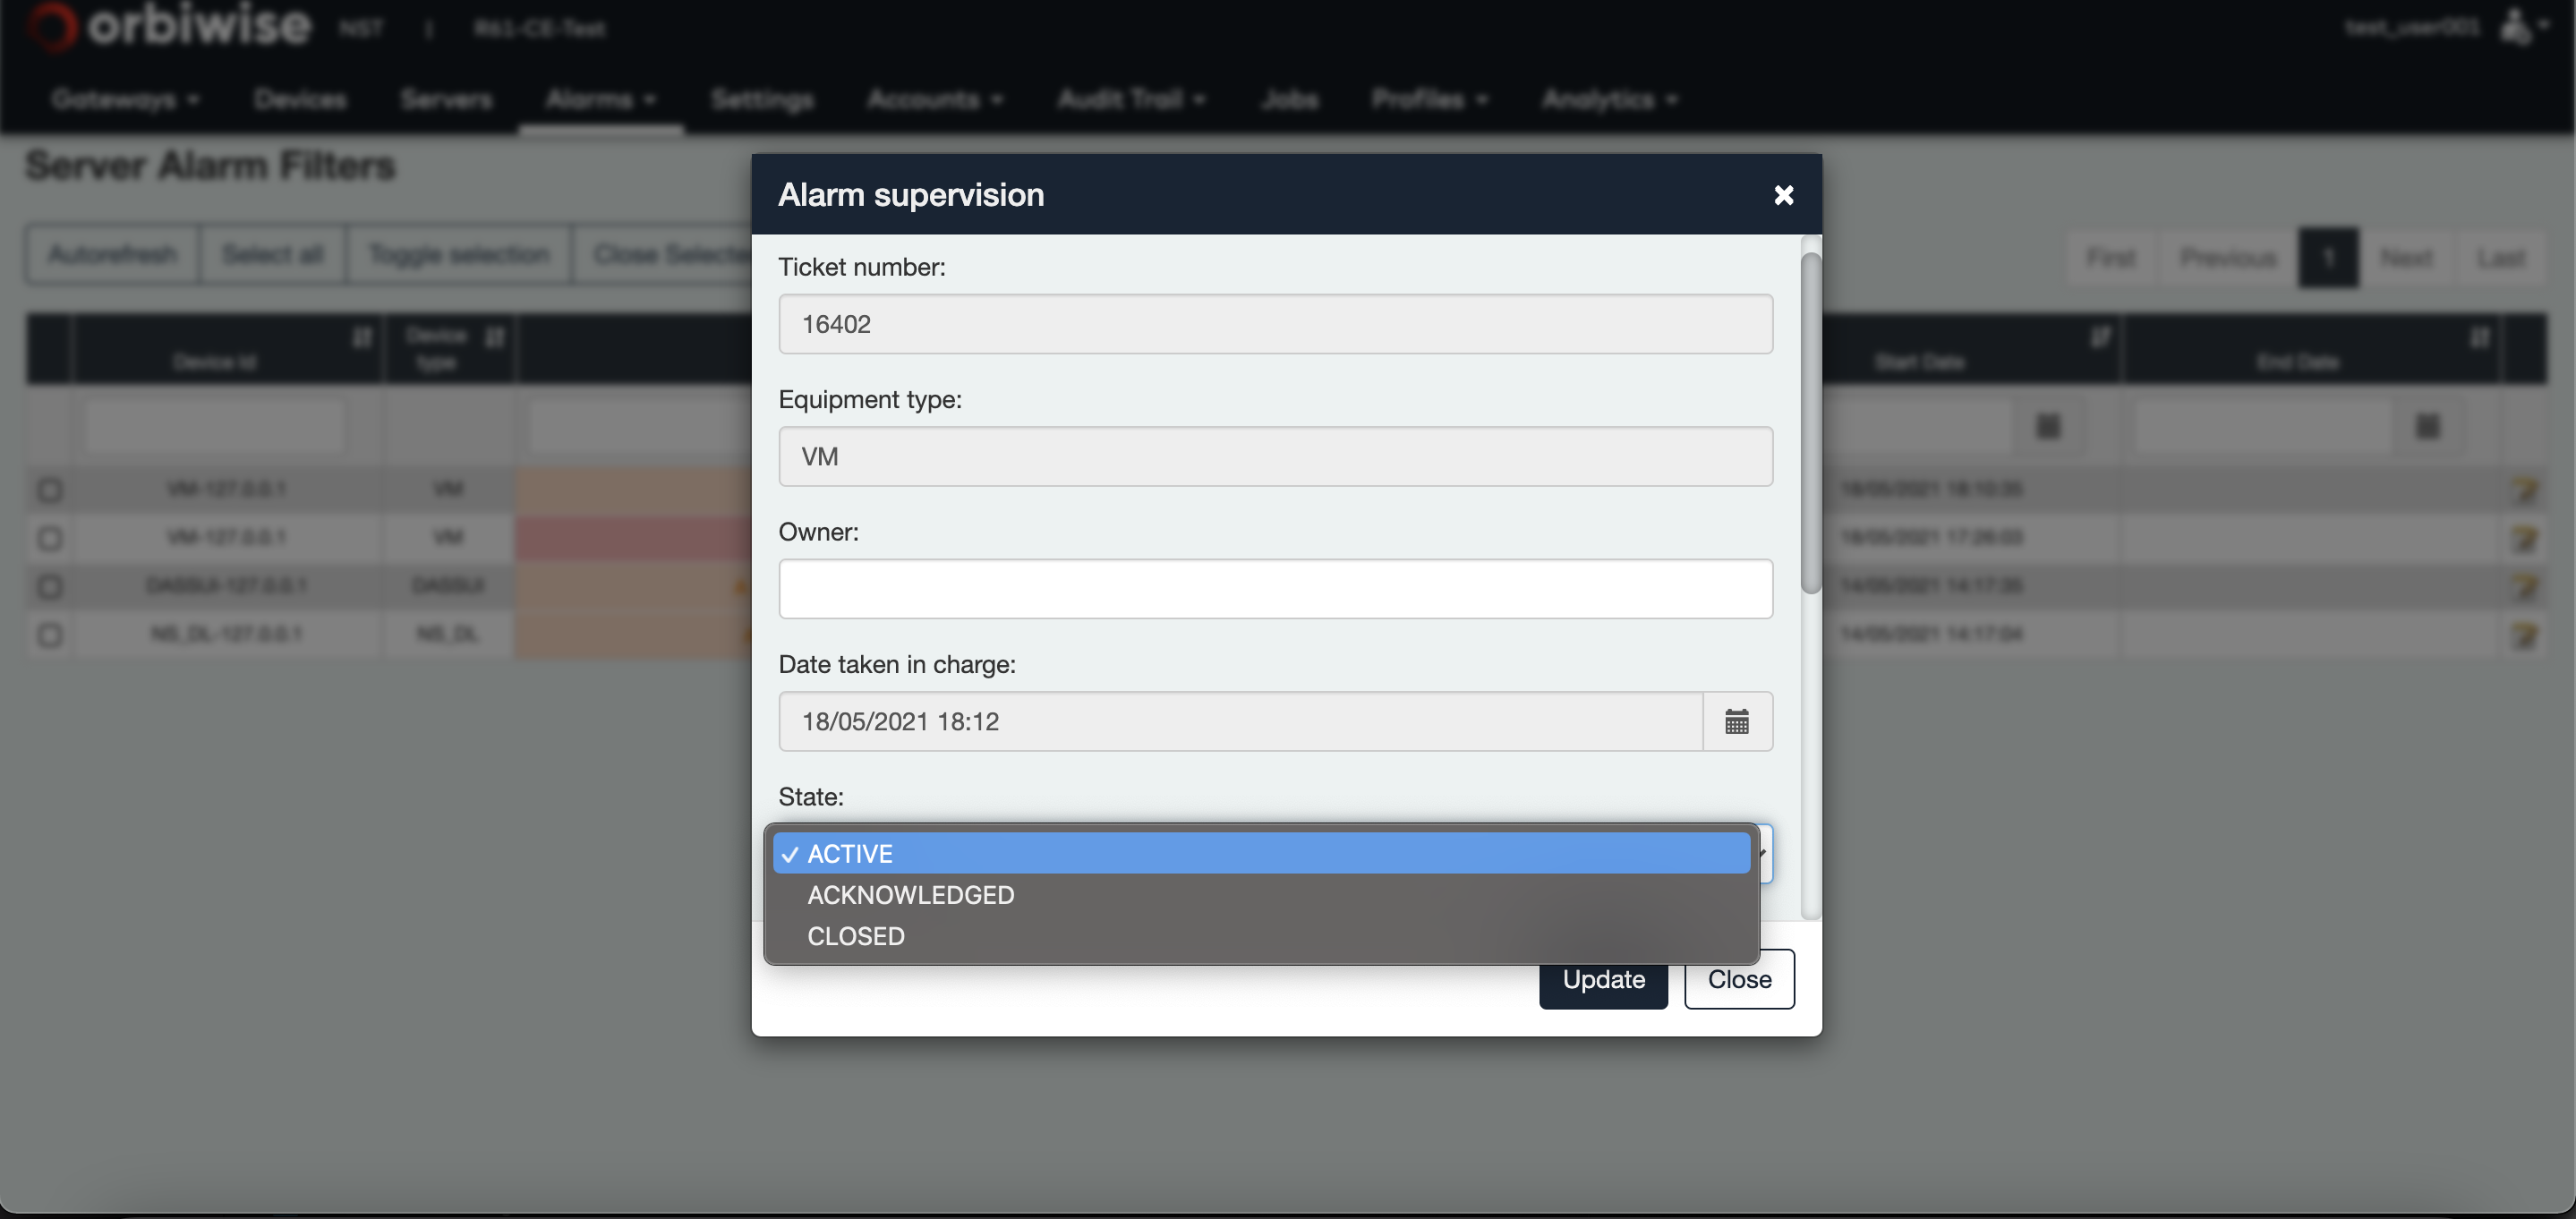
For the others, they need to be closed manually. For this, click on the Notepad button to edit the alarm. A pop-up will appear, change the state to Closed and then the alarm is marked as closed. It will disappear from on going alarm list.
Alarms are kept in a database for a number of days that is configurable.
Server alarms
The Table below lists the different functional server and virtual machine alarms, that can be raised, with the severity of the alarm, whether it is automatically closed of not, plus some comments for each alarm.
| Alarm | Severity | Auto closed | Comment |
|---|---|---|---|
| Server unreachable by OMC server | Major | Yes | The OMC server is checking the health of all the servers of the instance regularly. Whenever one server has not answering to this periodic check during a period of time, the alarm is raised. Whenever the server answers again, the alarm is automatically closed. |
| CPU load is high | Minor | Yes | This alarm is raised when the CPU load used by a server is reported as high during a pre-defined period of time. The CPU high-level detection threshold can be changed.The alarm is automatically closed when the CPU load falls below the threshold. |
| CPU load is too high | Major | Yes | This alarm is raised when the CPU load used by a server is reported as too high during a pre- defined period of time. The CPU too high-level detection threshold can be changed. The alarm is automatically closed when CPU load falls below the threshold. |
| Heap size used high | Minor | Yes | This alarm is raised when the size of the heap size used by the server reaches a threshold for a pre-defined period of time. The threshold is configurable . The alarm is automatically closed when the heap size falls below the threshold. |
| Heap size used too high | Major | Yes | This alarm is raised when the heap size used by the server reaches the threshold “heap size too high” for a pre-defined period of time. The threshold is configurable. The alarm is automatically closed when heap size falls below the threshold. |
| Max threads exceeded. OMC server restarted | Major | No | This alarm is raised whenever the number of threads in the OMC server is growing abnormally. The OMC server in this case will restart automatically. The alarm is not closed automatically, it is likely logs need to be check to understand the reason for the high number of threads. |
| VM unreachable by OMC server | Major | Yes | The OMC server is checking the health of all the virtual machines of the instance regularly.Whenever one VM has not answered to this periodic check during a pre-defined period of time, the alarm is raised. Whenever the VM answers again, the alarm is automatically closed. |
| VM average load is high | Minor | Yes | The OMC server checks the average load of all the VMs periodically. Whenever the average load exceeds the “ high” threshold (configurable on the NST) during a predefined period of time, the alarm is raised. The alarm is closed as soon as the average load falls below the threshold. |
| VM average load is too high | Major | Yes | The OMC server checks the average load of all the VMs periodically. Whenever the average load exceeds the “too high” threshold (configurable on the NST) during a predefined period of time, the alarm is raised. The alarm is closed as soon as the average load falls below the threshold. |
| VM memory used is high | Minor | Yes | The OMC server checks the used memory of all the VMs periodically. Whenever the used memory exceeds a “high” threshold (configurable on the NST),the alarm is raised. The alarm is automatically closed, when the used memory falls below the threshold. |
| VM memory used is too high | Major | Yes | The OMC server checks the used memory of all the VMs periodically. Whenever the used memory exceeds a “too high” threshold configurable on the NST, the alarm is raised. The alarm is automatically closed, when the used memory falls below the threshold. |
| VM disk space low | Minor | Yes | The OMC server checks the remaining disk space of all the VMs periodically. Whenever the remaining disk space falls below a “low” threshold configurable on the NST, the alarm is raised. The alarm is automatically closed when the remaining disk space exceeds the threshold. |
| VM disk space too low | Major | Yes | The OMC server checks the remaining disk space of all the VMs periodically. Whenever the remaining disk space falls below a “too low” threshold configurable on the NST, the alarm is raised. The alarm is automatically closed when the remaining disk space exceeds the threshold. |
| NetServer errorlog | Minor | No | Whenever an unexpected event happens on a server, this event is traced in an errorlog file. In order to be notified of the event, an alarm is raised when the file grows in size. This alarm needs to be manually closed. |
| Number of PostGreSQL connection high | Minor | Yes | Whenever the number of connections to the PostGreSQL database exceeds a threshold that can be set on the NST (refer to section 9.4), an alarm is raised. The alarm is automatically cleared whenever the number of connections to the database falls below the threshold. |
| NetServer max number of UL threads reached. Server restarted. | Major | No | This alarm is raised whenever the number of UL threads in the network server is growing abnormally. The network server in this case will restart automatically. The alarm is not closed automatically at it is likely logs needs to be checked to understand the reason for the high number of threads. |
| NetServer max number of DL threads reached. Server restarted | Major | No | This alarm is raised whenever the number of DL threads in the network server is growing abnormally. The network server in this case will restart automatically. The alarm is not closed automatically as it is likely logs need to be checked to understand the reason for the high number of threads. |
| Server was unreachable by OMC and has been successfully restarted | Major | No | Whenever the network server or the DASS server is not answering to the periodic check performed by the OMC server during a pre-defined period of time, the OMC server will try to restart the failing server. In case of a successful restart of the server, the alarm is raised. If not, the alarm is not raised but the “Server unreachable by OMC server” alarm will be raised. This alarm needs to be cleared manually. |
| No Cassandra host available reported by network server | Major | Yes | Whenever the Network Server is unable to reach any Cassandra database nodes, it will raise this alarm. The alarm is closed automatically whenever the Cassandra nodes become available again. |