Gateway Provisioning
Please follow the below Video to latch LoRaWAN Gateway to OrbiWise Instance :
Gateway Management
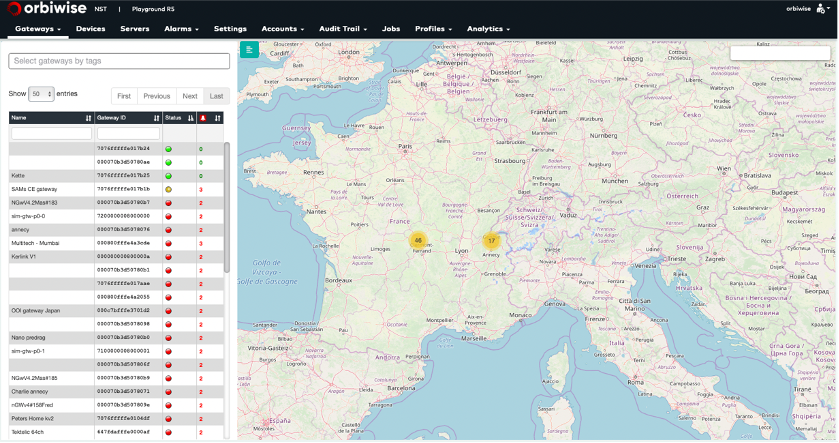
After a successful login, the user accesses the main page of the Network Supervision Tool. The screen is split into three regions:
- At the top is the navigation menu that gives access to all the screens of the NST.
- On the center-right region, a map shows location of gateways.
- The hidable center-left region shows the list of gateways with their current status and the number of alarms that have been raised for each of them. Gateways can be filter by textual search or by tags
Note: That the same user can open only one session of the Network Supervision Tool at a time. If the same user logs in on a different PC, the previous session will be automatically closed.
Gateway administration
The Gateways section provides tools to register, configure, delete and administrate gateways. The NST provides an overview of the physical network infrastructure and its current state through the dashboard display of the gateways’ positions, list view of the gateways’ types and status together with the necessary control to authorize/block gateways on the network. Network management is facilitated by the use of tags on gateways so as to filter specific groups of gateways.
By clicking on the “Gateways” tab name, the user gets access to a list of sub-sections that are described hereafter.
Dashboard View

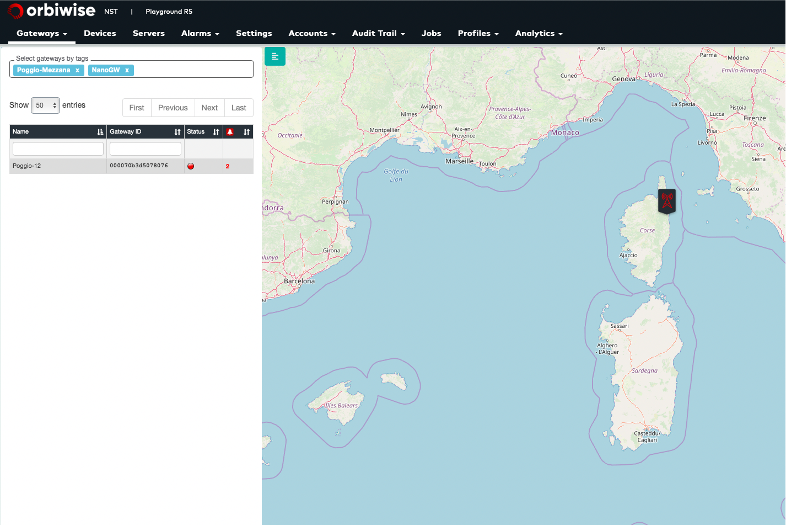
The main dashboard shows the tag filtered list of gateways that have been authorized to connect the OrbiWAN solution.
Whenever gateways are equipped with GPS and succeed to lock the GPS signal, they will automatically report their position and appear on the map in their actual position. It can take up to 15 min from GPS position is acquired to the position is actually displayed in the NST.
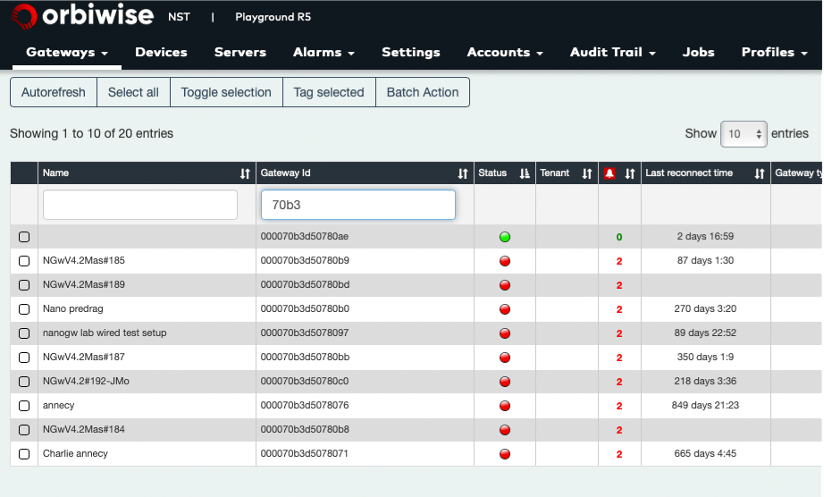
On the left side of this dashboard, the list of gateways connected to the network is presented with the following information for each gateway:
- Name: “nickname” given by the user at registration of the gateway.
- ID: unique identifier based on the MAC address of the gateway.
- Status: highest level of alarm still active for the gateway.
- Number of alarms still active for the gateway.
The list view of gateways gives a quick status of all the gateways. A green status indicates that the gateway is operational. A red status led for the gateway indicates that at least one alarm for the gateway is on going. The number of alarms is indicated next to the status LED. The 2D map is normally centred on a reference location that is a parameter of the instance. The map is displayed only if Internet access is available.
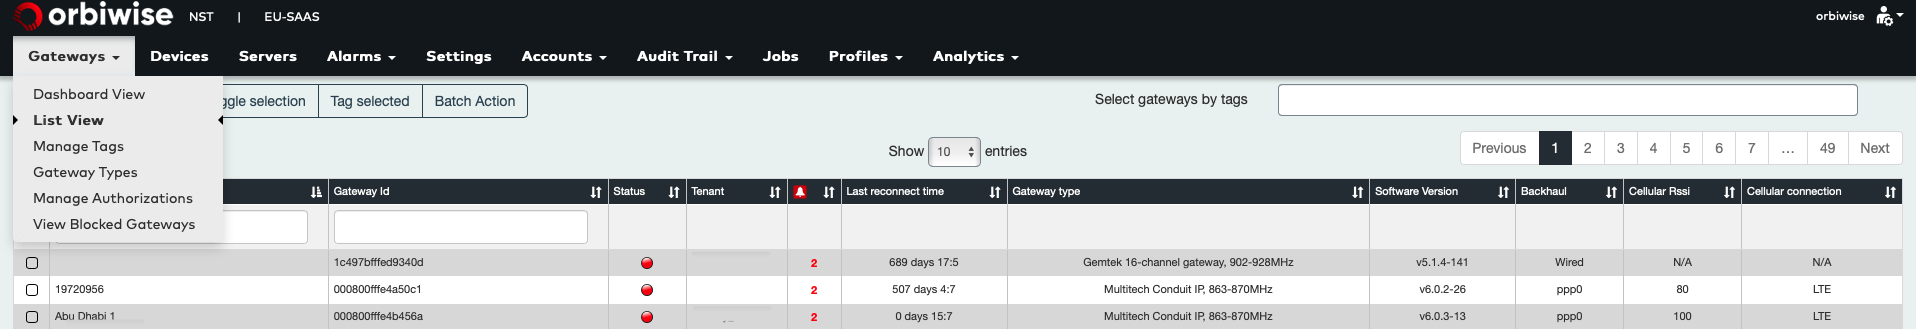
List View
By clicking on the list view field of the drop-down (see Figure under gateway administration tab), the user gets access to a different gateway view. It provides to the user a more detailed view of each of the gateways, with the Dashboard view’s Name, ID status and number of alarms:
- Gateways’ model type.
- Software version.
- Active backhaul: Ethernet or Cellular (provided Gateway has an active SIM card).
And if backhaul is Cellular:
- Cellular RSSI.
- Cellular connection type (e.g. GPRS, EDGE, WCDMA, HSDPA,…).
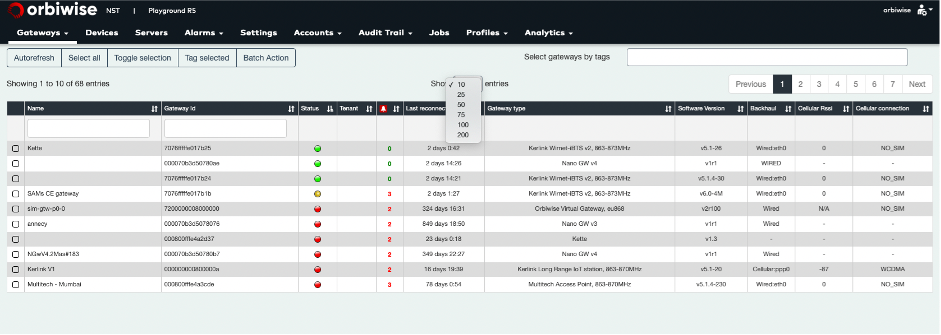
The gateway list view as on the main dashboard is filtered on selected tags. Figure below shows an example a tag-filtered view.
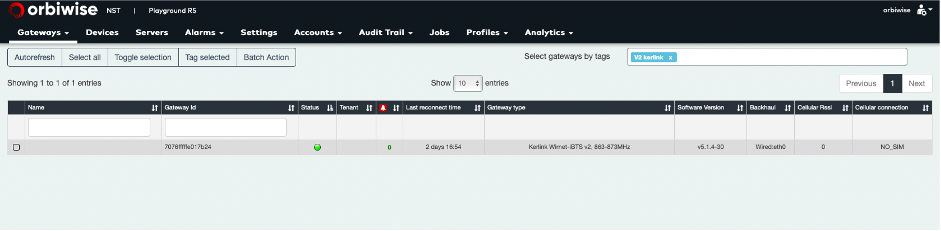
The list view provides also a filtering tool by gateway identifier or by gateway name (see Figure below as example).
Tags management
Under Tag Management: As long as the radio network is getting deployed, the number of gateways is increasing. Once this number reaches hundreds or thousands of gateways, the full list of gateways as displayed in Figure 6 and Figure 7 starts to be unmanageable. –> As long as the radio network is getting deployed, the number of gateways is increasing. Once this number reaches hundreds or thousands of gateways, the full list of gateways are displayed which becomes unmanageable.
In order to restrict the number of gateways displayed on the screen, gateways can be filtered based on tags. One or several tags can be associated to a gateway. The selection tool in the NST will filter gateways that are associated to the selected tags.
Figure under Tag definition section shows an example of gateway filtering based on two tags. One tag is used for location and another tag is used for gateway type.
The tag management system is very flexible and allows any customer to filter gateways on the criteria of their choice.
Tag definition
By clicking on the manage tags field of the drop-down, the user gets access to the gateway tag management user interface.
Below Figure displays the main interface for tags management. As an example two tags categories have been defined: gateway location and gateway type. This will allow gateway filtering based on gateway location and/or gateway type.
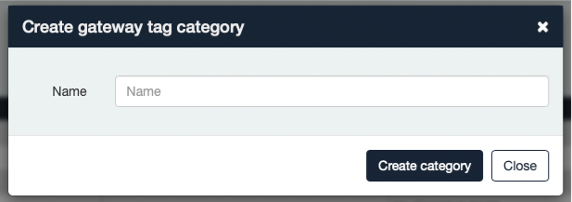
Clicking on the Create category button will launch a new window (see Figure 12) that will allow the user to create a new tag category.
Once a new category has been created, new tags can be added by clicking on the Create tag button. A new window as displayed on Figure 13 will appear.
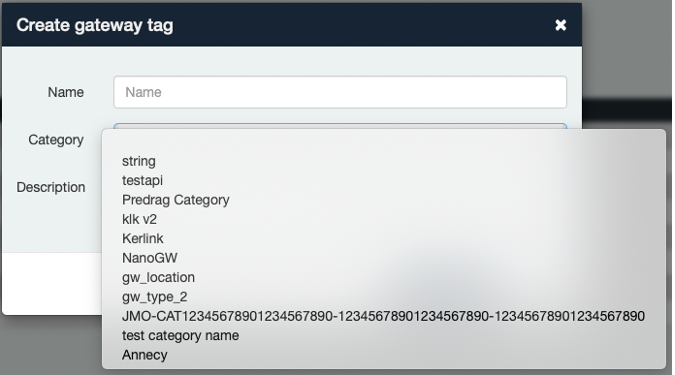
The user will define a new tag name and will associate it to a tag category. Once created the tag will appear in the list of existing tags.
Tag associotion
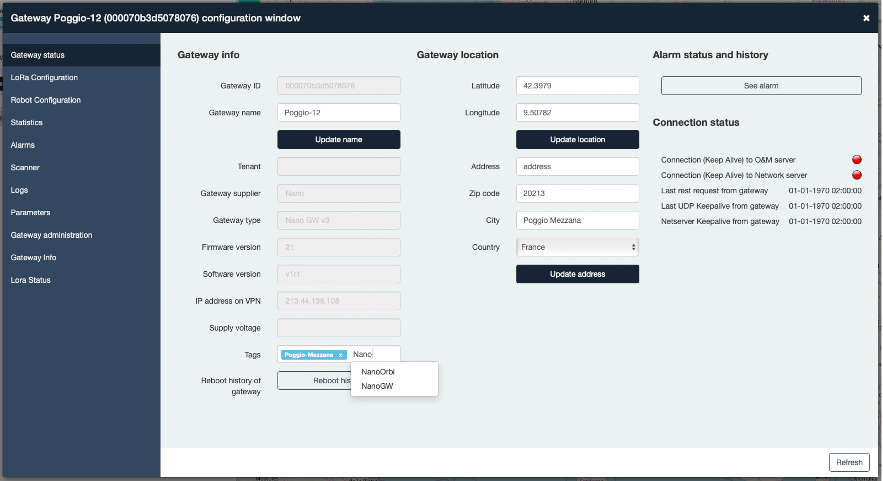
A tag’s association to a gateway is performed on a gateway-by-gateway basis at the moment. Tag association can only be performed in the Gateway configuration window as shown in Figure below. The tags are added in the Tags field of the window. Tags already defined are available for selection.
LoRa Configuration
By clicking on the LoRa Configuration tab, the user accesses the panel used to set and see the current radio configuration of the gateway.
A gateway may have several Radio Rront-Ends (RFE) allowing transmission and reception in a certain frequency band of end-devices LoRa packets.
- A RFE can be activated or disabled.
- When an RFE is activated, the gateway transmits and receives the LoRa packets along channels that are defined by the user.
Add below lines in the subtask.
The number of channels depends on the gateway hardware.
The set of channels that can be used depends on the regional radio frequency rules.
Figure below shows an example of radio configuration dialog:
The user can deactivate all the LoRa RFEs by clicking on the button Stop LoRa Radio. When radio is stopped, the LoRa RFEs can be activated again by clicking on button Apply settings and Start/re-start LoRa Radio.
Note: When the LoRa RFEs are all de-activated, an alarm is raised indicating that for the select gateway the LoRa radio is off.
Individual RFEs are disabled by double-clicking on them.
Figure below shows a gateway with two RFEs. One of them is activated, whereas one is disabled. The number of RFEs supported by the gateway is provided during first configuration of the gateway. At this time, the gateway provides its capabilities with a number of RFEs supported, max TX power, GPS support, etc.
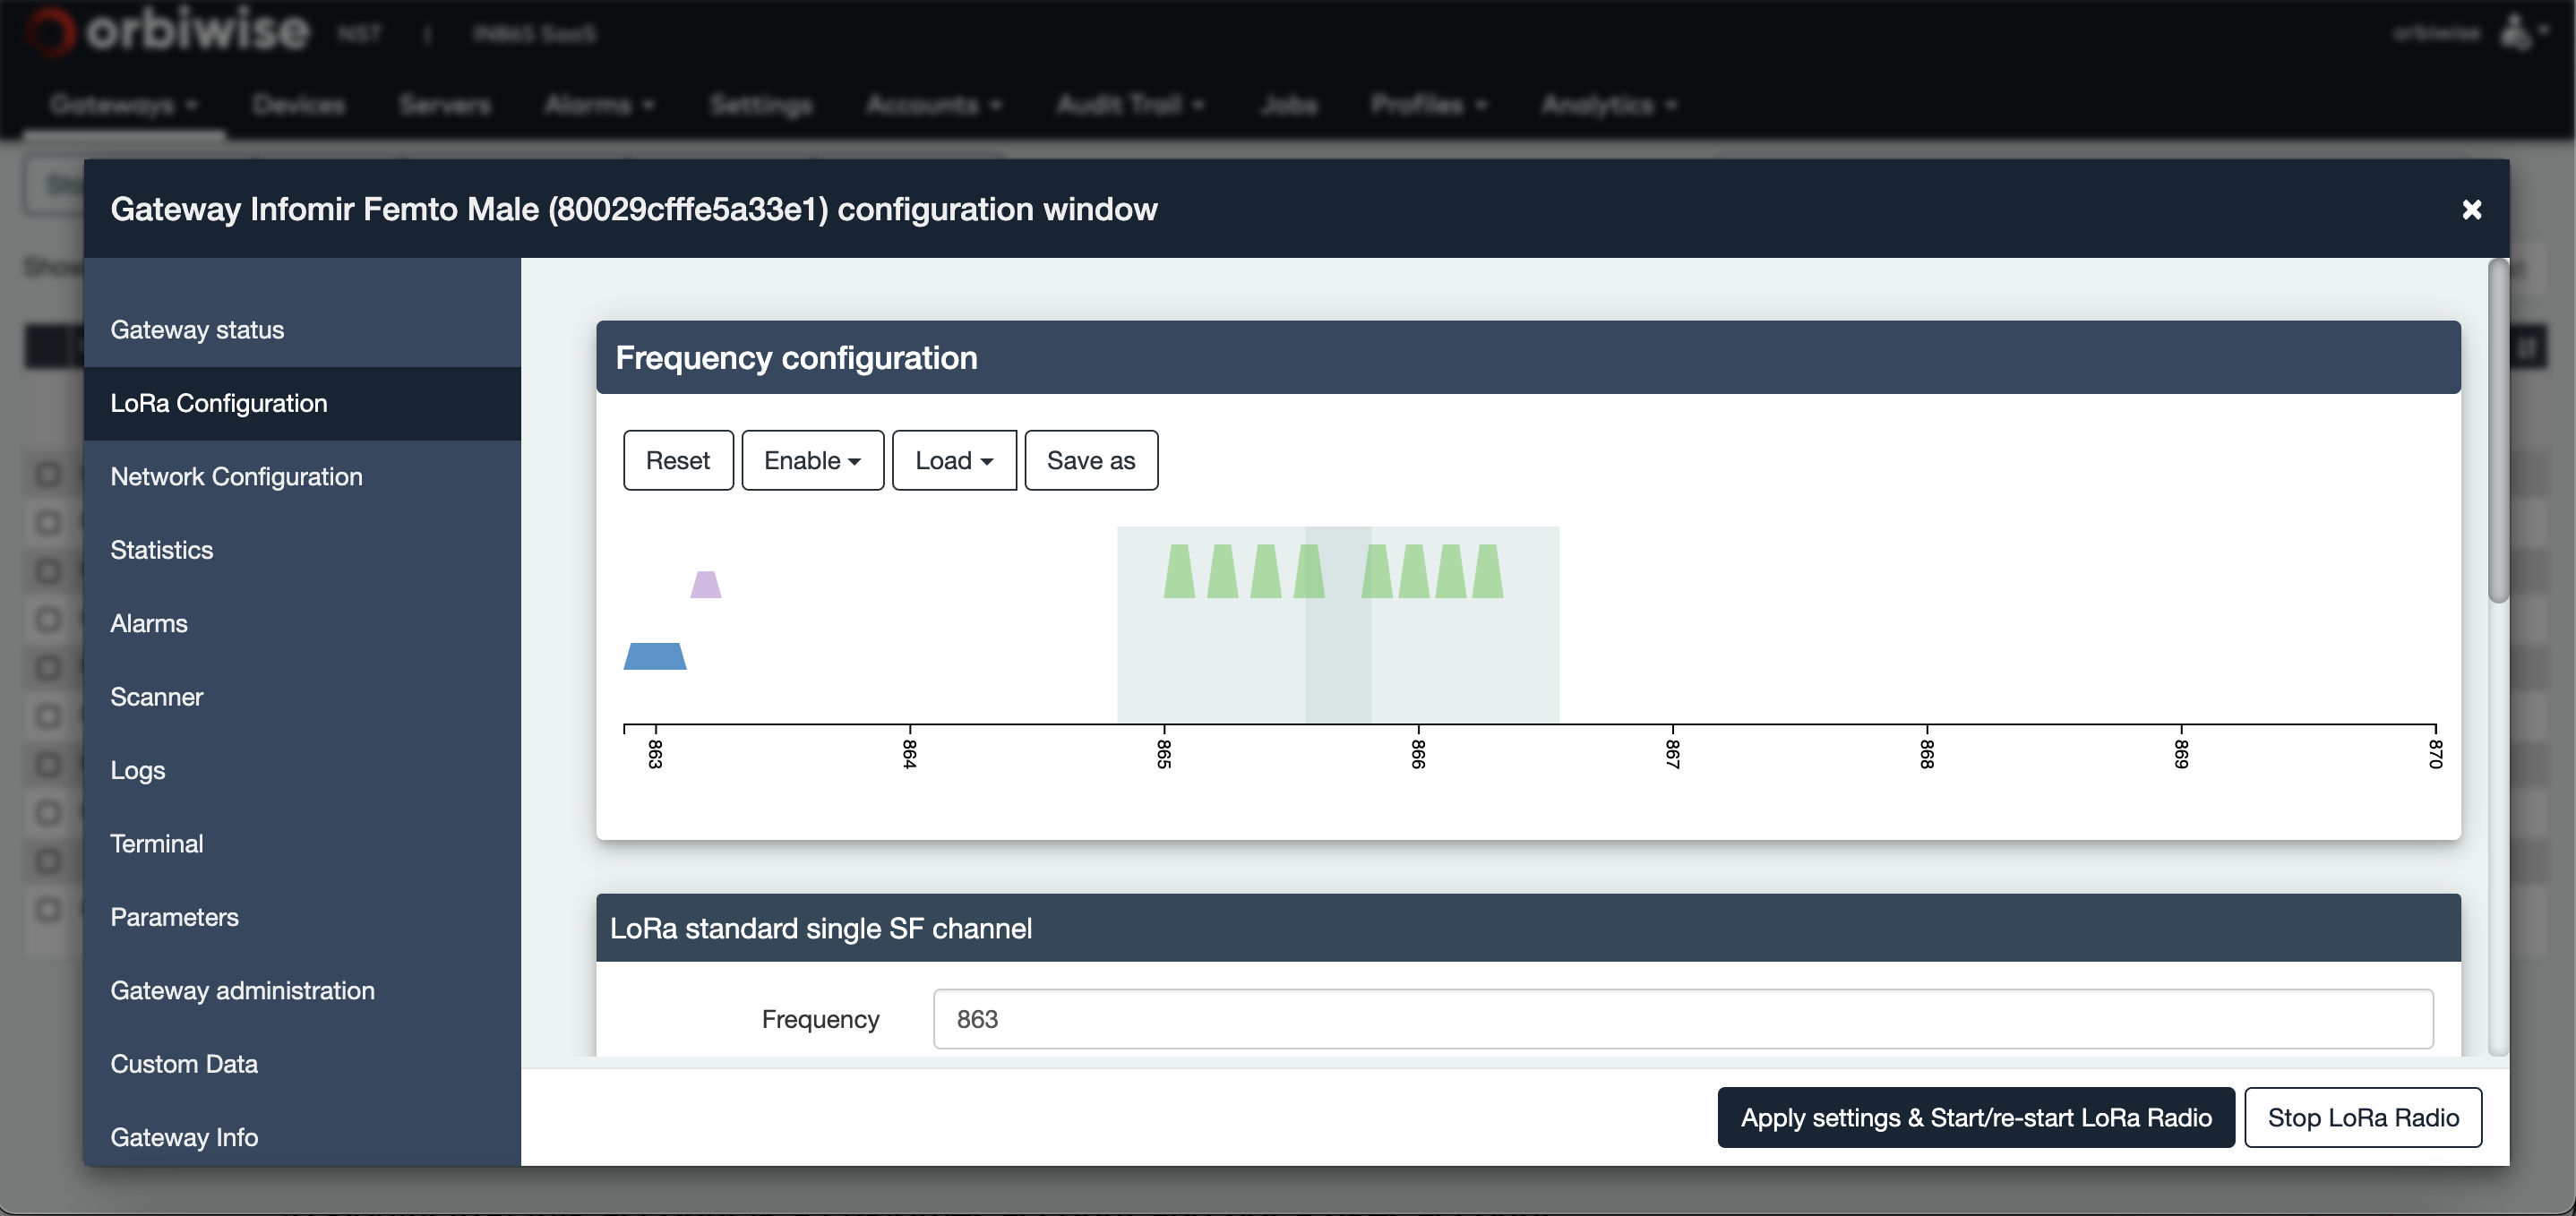
The radio front-end (RFE) of a LoRa Gateway is represented by a light blue rectangle. By clicking on one RFE rectangle, its center frequency in MHz is displayed in the Radio frame.

The RFE center frequency can be changed either manually by changing the value of the frequency field in the radio frame or by sliding the RFE rectangle to the left or right.
Note: The bandwidth field is fixed since the gateway vendor defines it. One end-device transmits radio packets on channels that are identified by:
- The type of modulation used (LoRa or FSK in some regions).
- The bandwidth of the channel (125kHz, 250 kHz, 500 kHz).
- The data rate used.
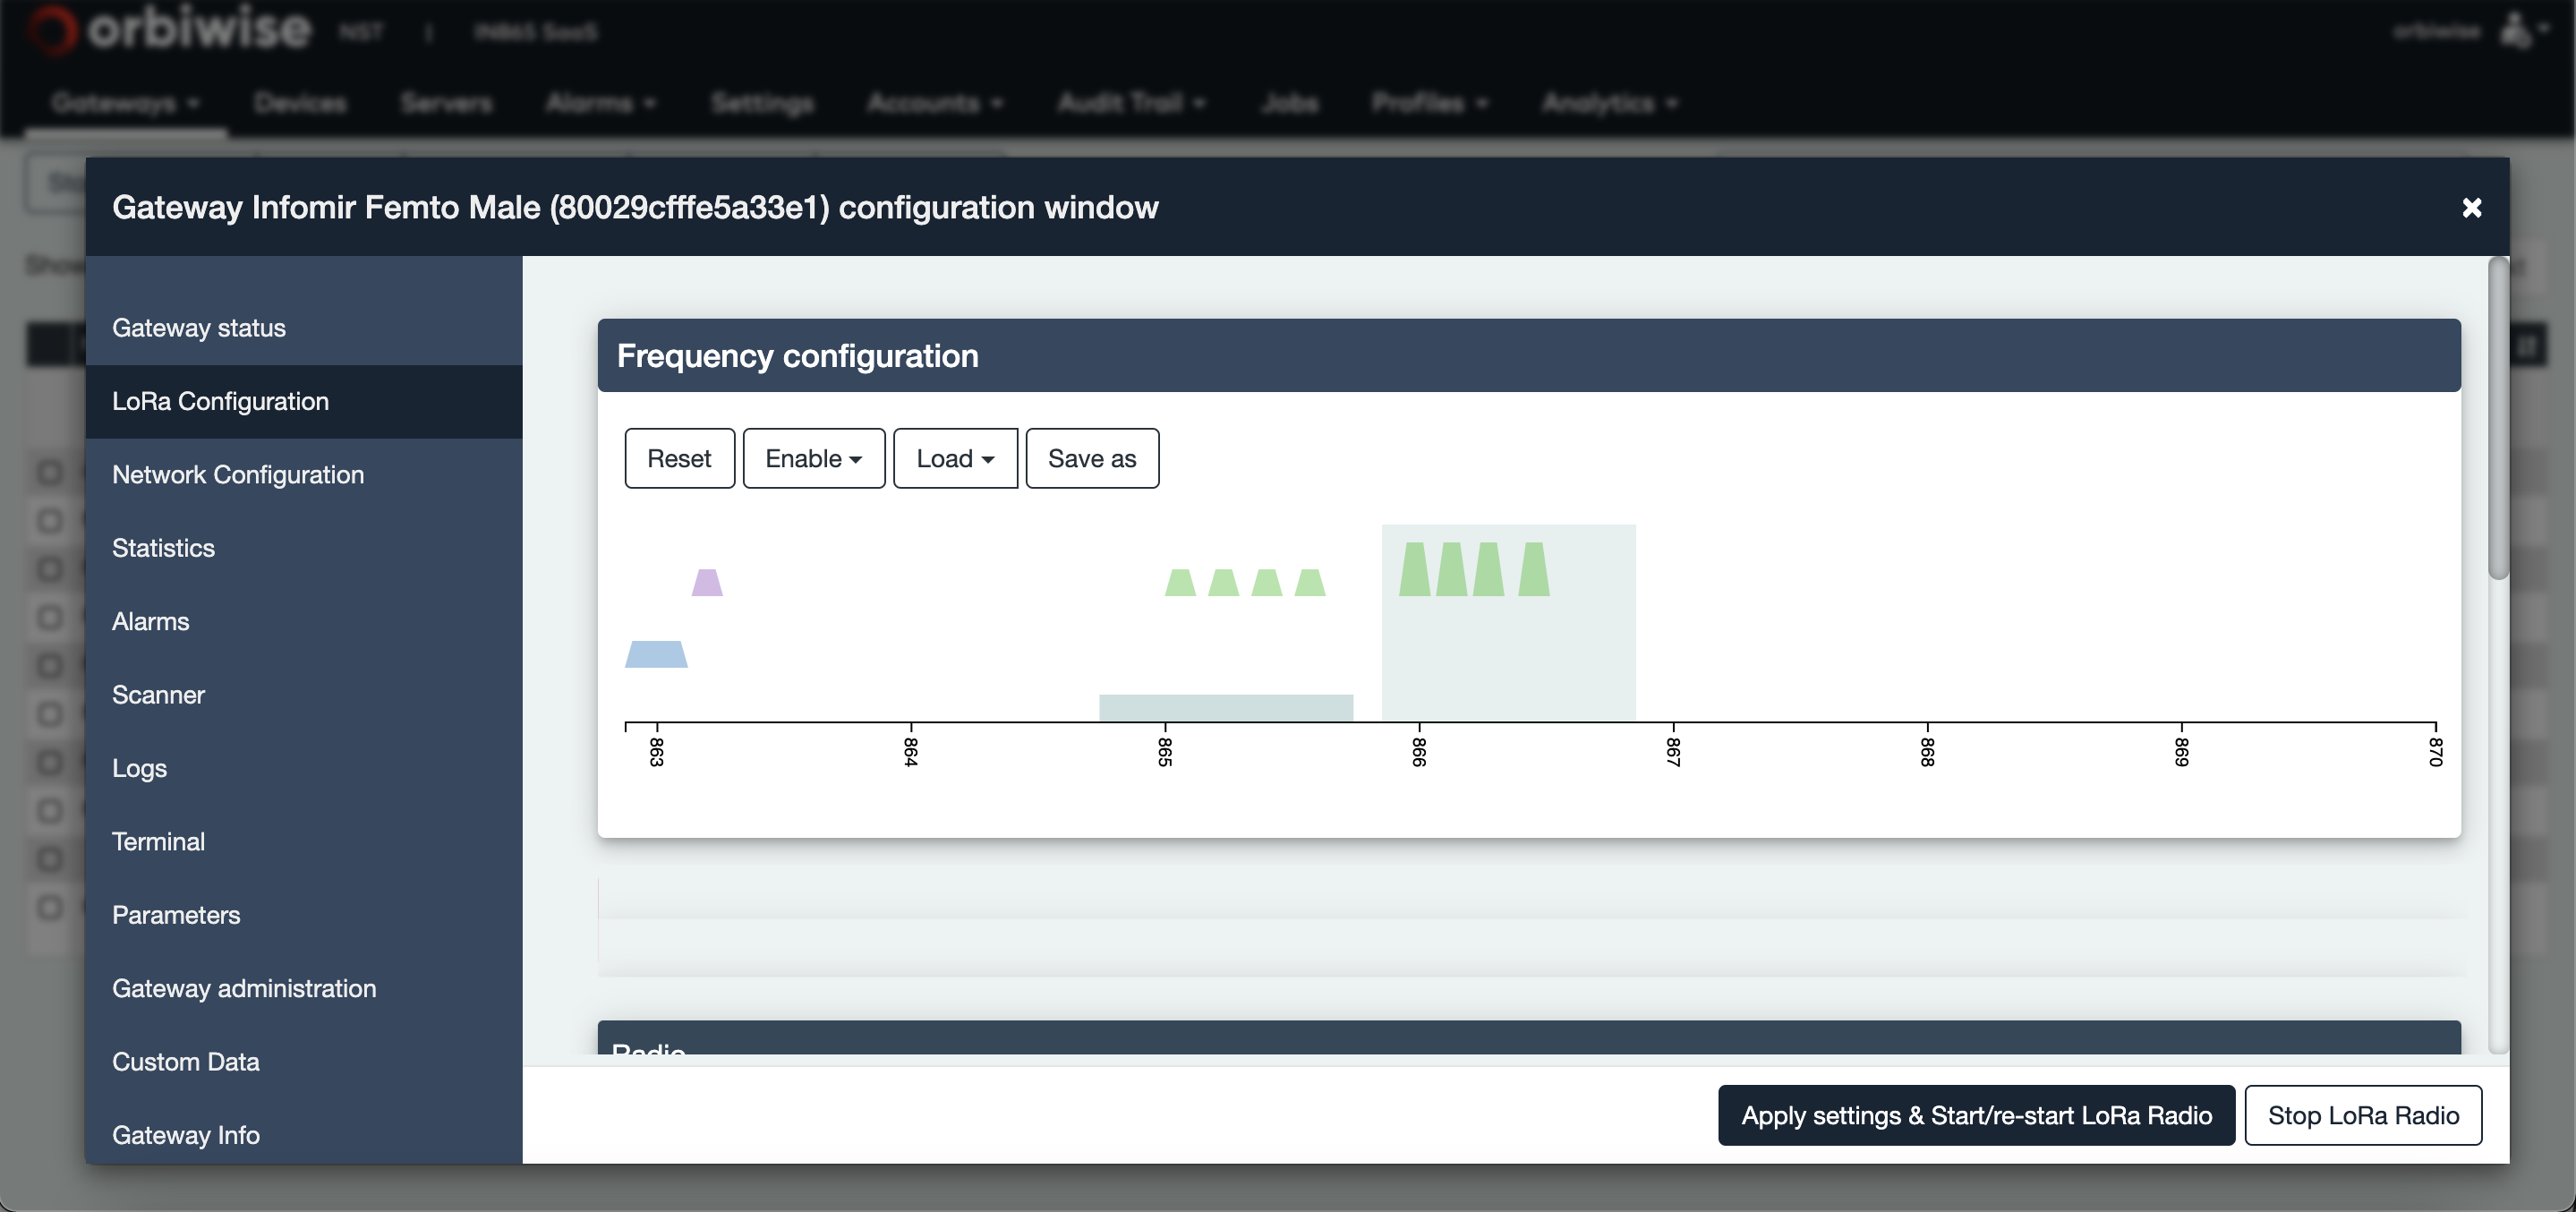
Channels are set on an RFE rectangle for reception purposes. The channels are represented with pod form. The pod length is proportional to the bandwidth of the channel.
For optimal reception, the pods shall be placed inside the RFE rectangle. If not, the NST will not allow enabling them.
Channels are set on an RFE rectangle for reception purposes. The channels are represented with pod form. The pod length is proportional to the bandwidth of the channel.
For optimal reception, the pods shall be placed inside the RFE rectangle. If not, the NST will not allow enabling them as shown in the image below:
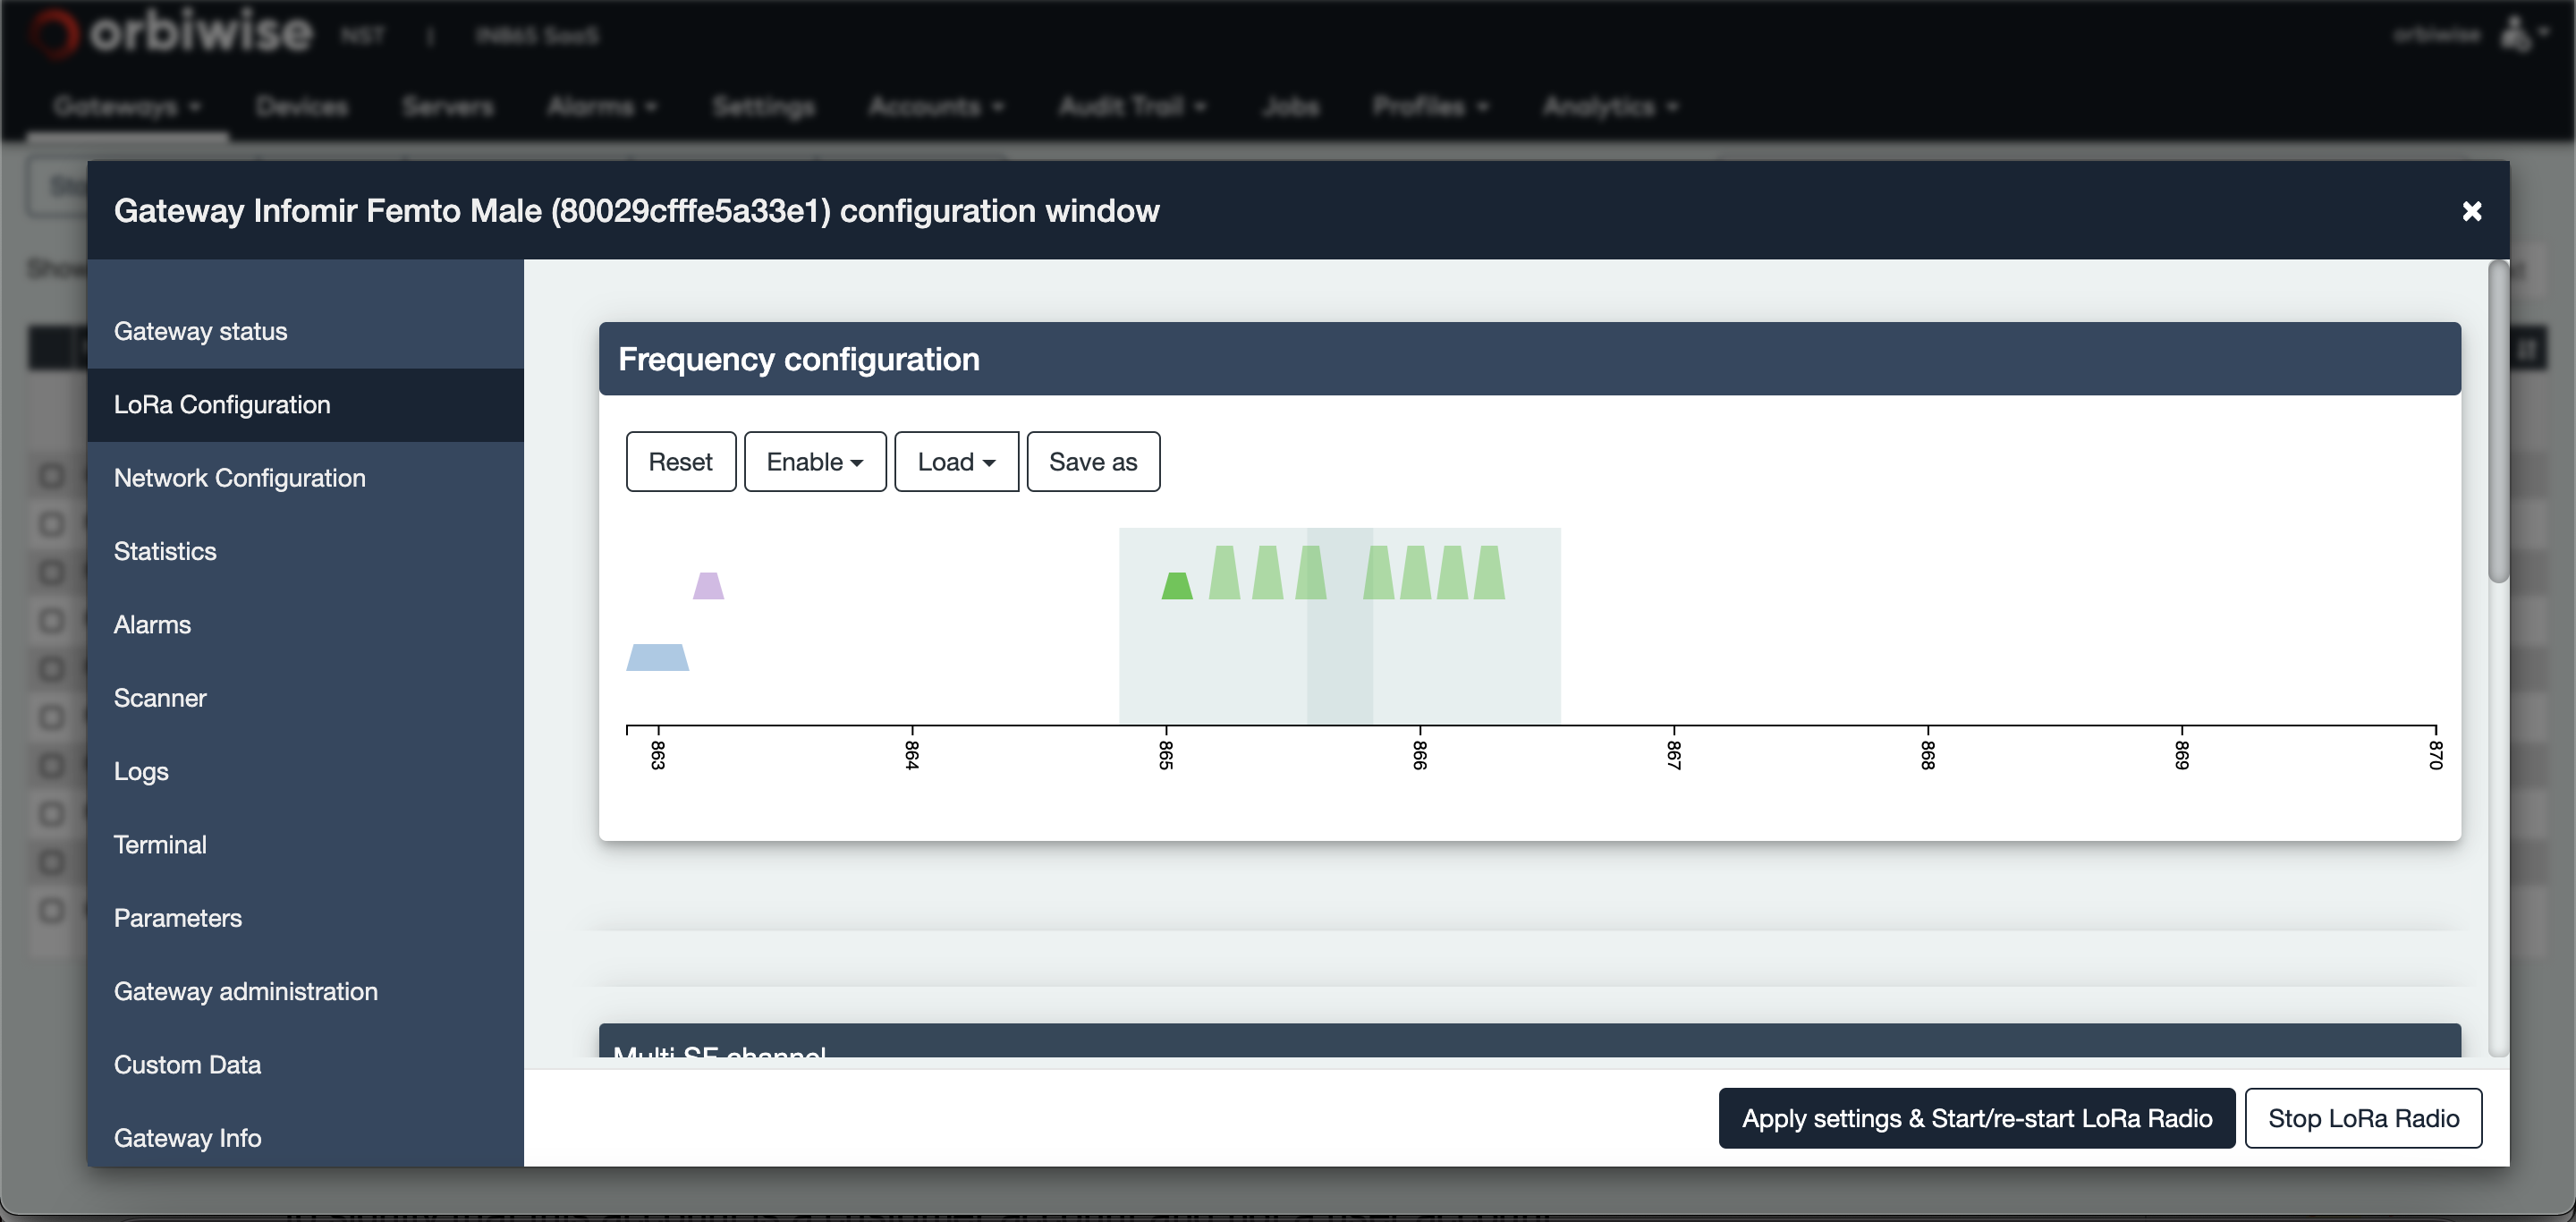
There are three types of channel that are represented with different colors:
-
Green is the Multi SF channel. It has a fixed bandwidth of 125kHz, performs LoRa demodulation and can decode all Spreading Factors (SF) from SF7 to SF12.
-
Blue is the LoRa standard single SF channel that can decode only one SF and that can be tuned to 250kHz or 500kHz bandwidth.
-
Purple is the FSK channel that can be used in some regions.
| Channel Color | Modulation | Channel bandwidth (kHz) | SF (spreading factor) |
|---|---|---|---|
| Green | LoRa | 125 | 7,8,9,10,11,12 |
| Purple | FSK | 250 or 500 | One SF only, region specific |
| Blue | LoRa | 25 | NA |
Note: Whenever a configuration has been changed, the user shall press the Apply settings and Start/restart LoRa radio button in order to push it to the gateway and save it.
The OrbiWAN solution allows dynamic frequency plan reconfiguration. Whenever the frequency plan of a given gateway is changed (some channels might need to be removed due to interference problems and others allocated), the network server will dynamically and automatically modify the frequency allocation of all the end-devices that “belong” to that modified gateway.
This is only valid for devices:
- That have been registered without profile.
- That have been registered with profile but with the “Use gateway Channel plan” field of the channel profile selected.
Beacon Configuration
Inside the same configuration frame, it is also possible to enable the beacon broadcasting by the gateway. A checked-box is used for control of enabling/disabling.
Note: That if the gateway does not support GPS (it is mandatory to have GPS synchronization for beacon broadcasting), a change in the checked-box will not be allowed by the NST. The checked-box will remain grey.
The beacon frequency is indicated but cannot be changed since it is fixed for each region of the world.
![]()
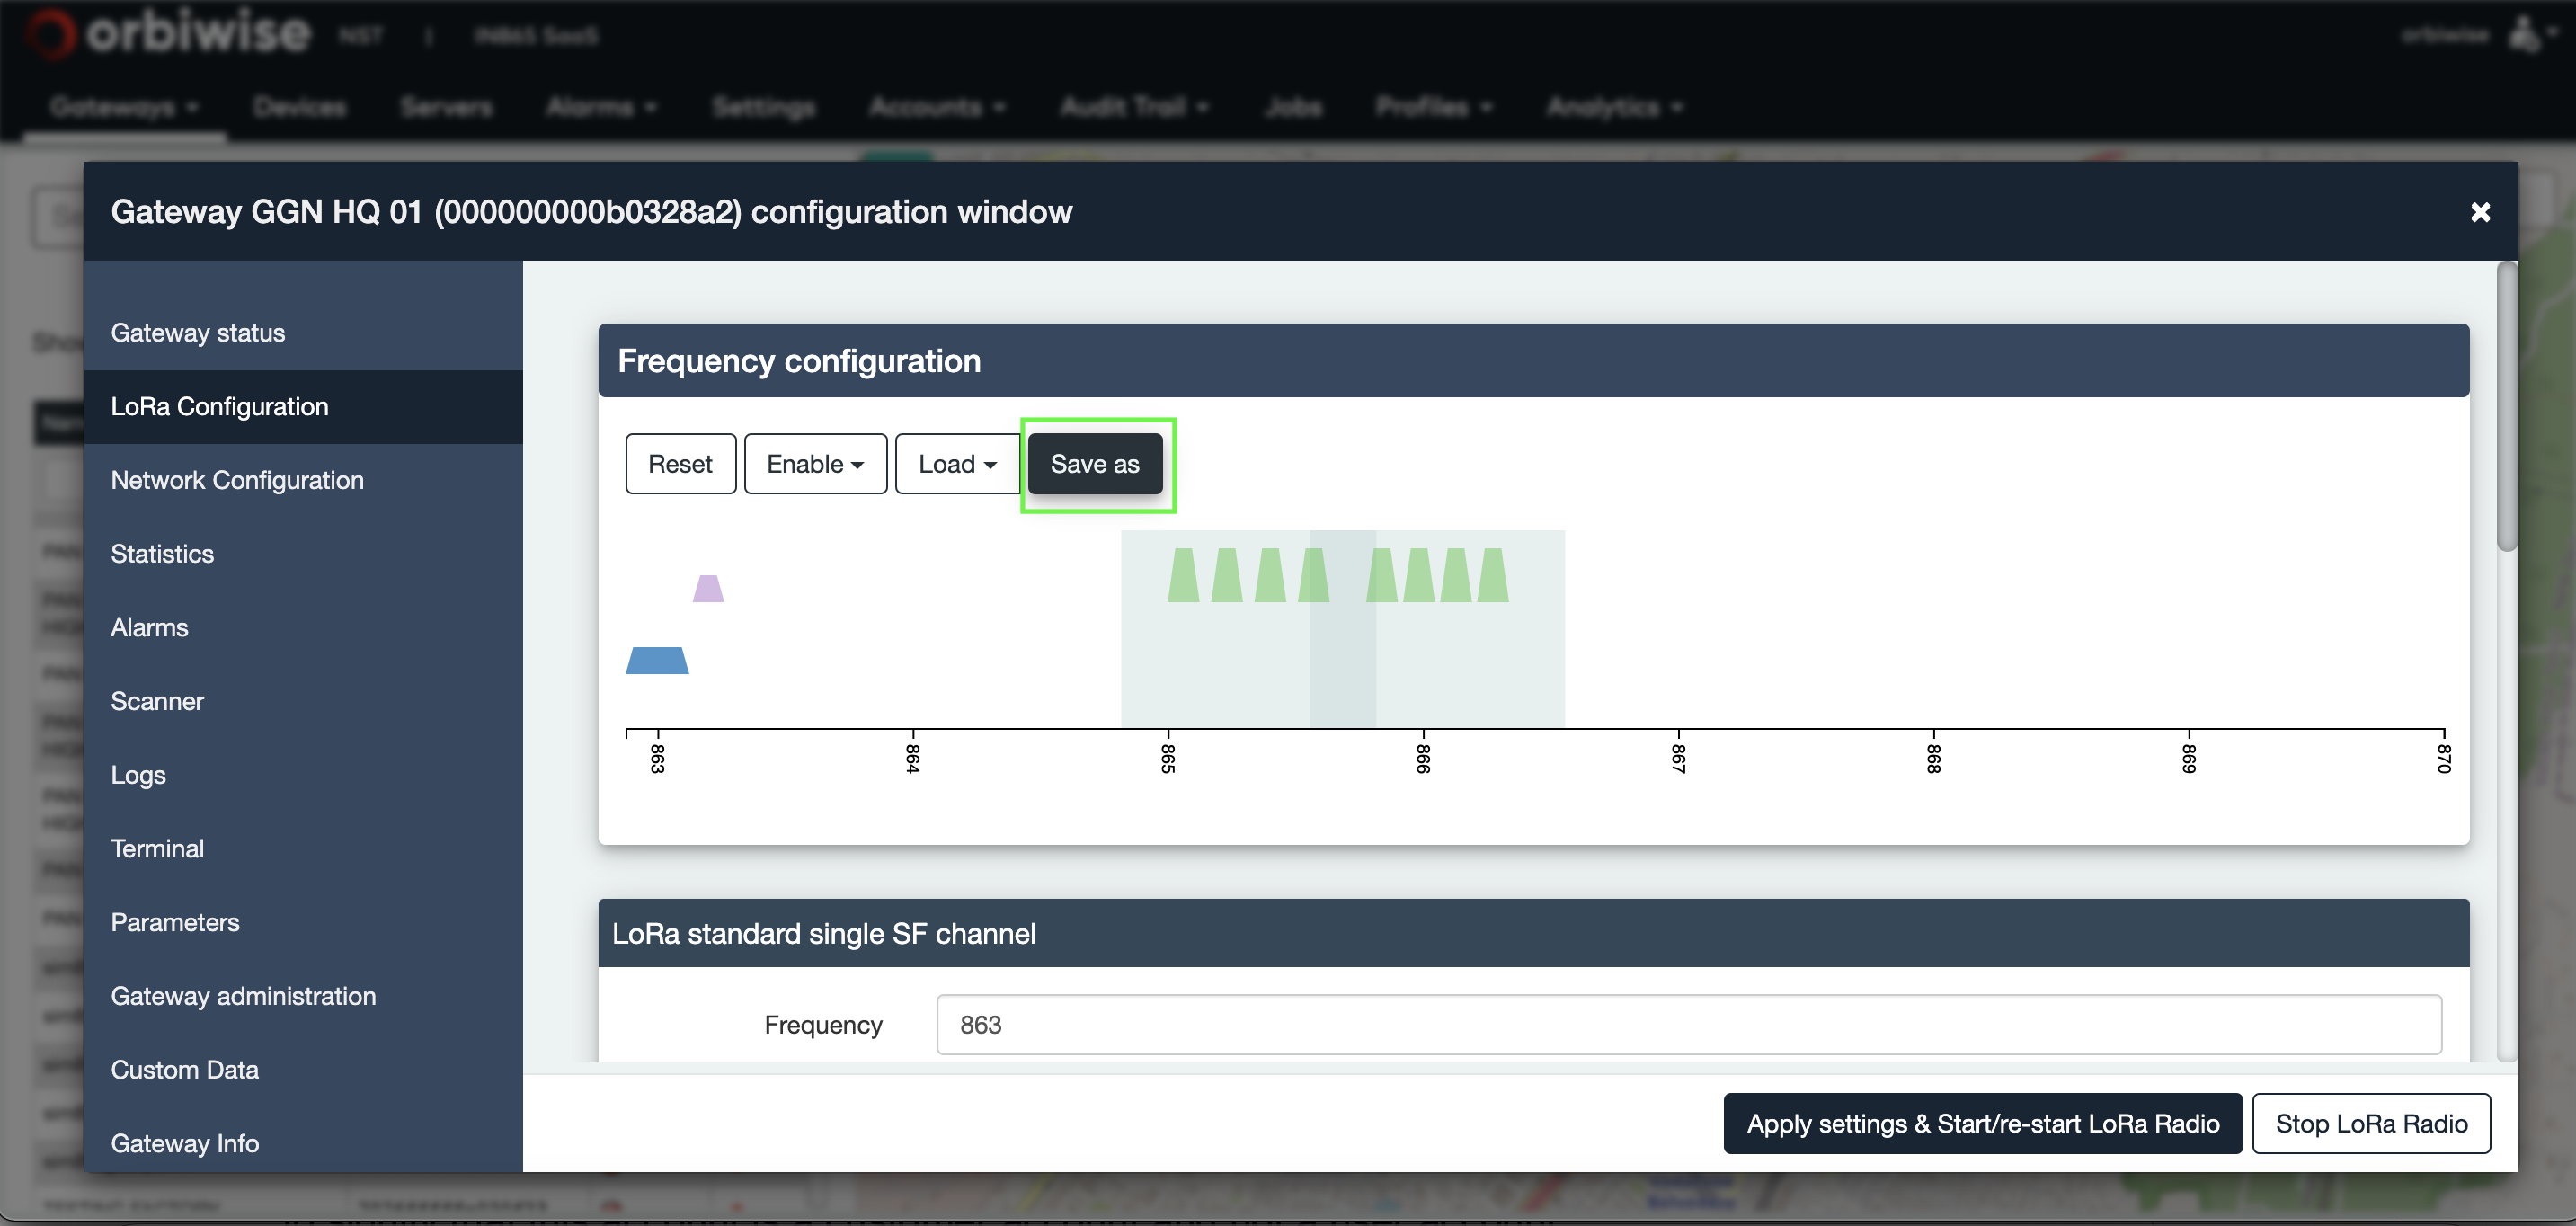
Saving/Re-use of a radio frequency configuration
The frequency configuration frame of the LoRa configuration tab allows saving of a dedicated radio configuration.
Whenever the user thinks that a dedicated frequency configuration might be useful to be set on other gateways, the user can save it.
For this, press the save as button. A new dialog as shown in image below will appear. Just give a name to the configuration you want to save.
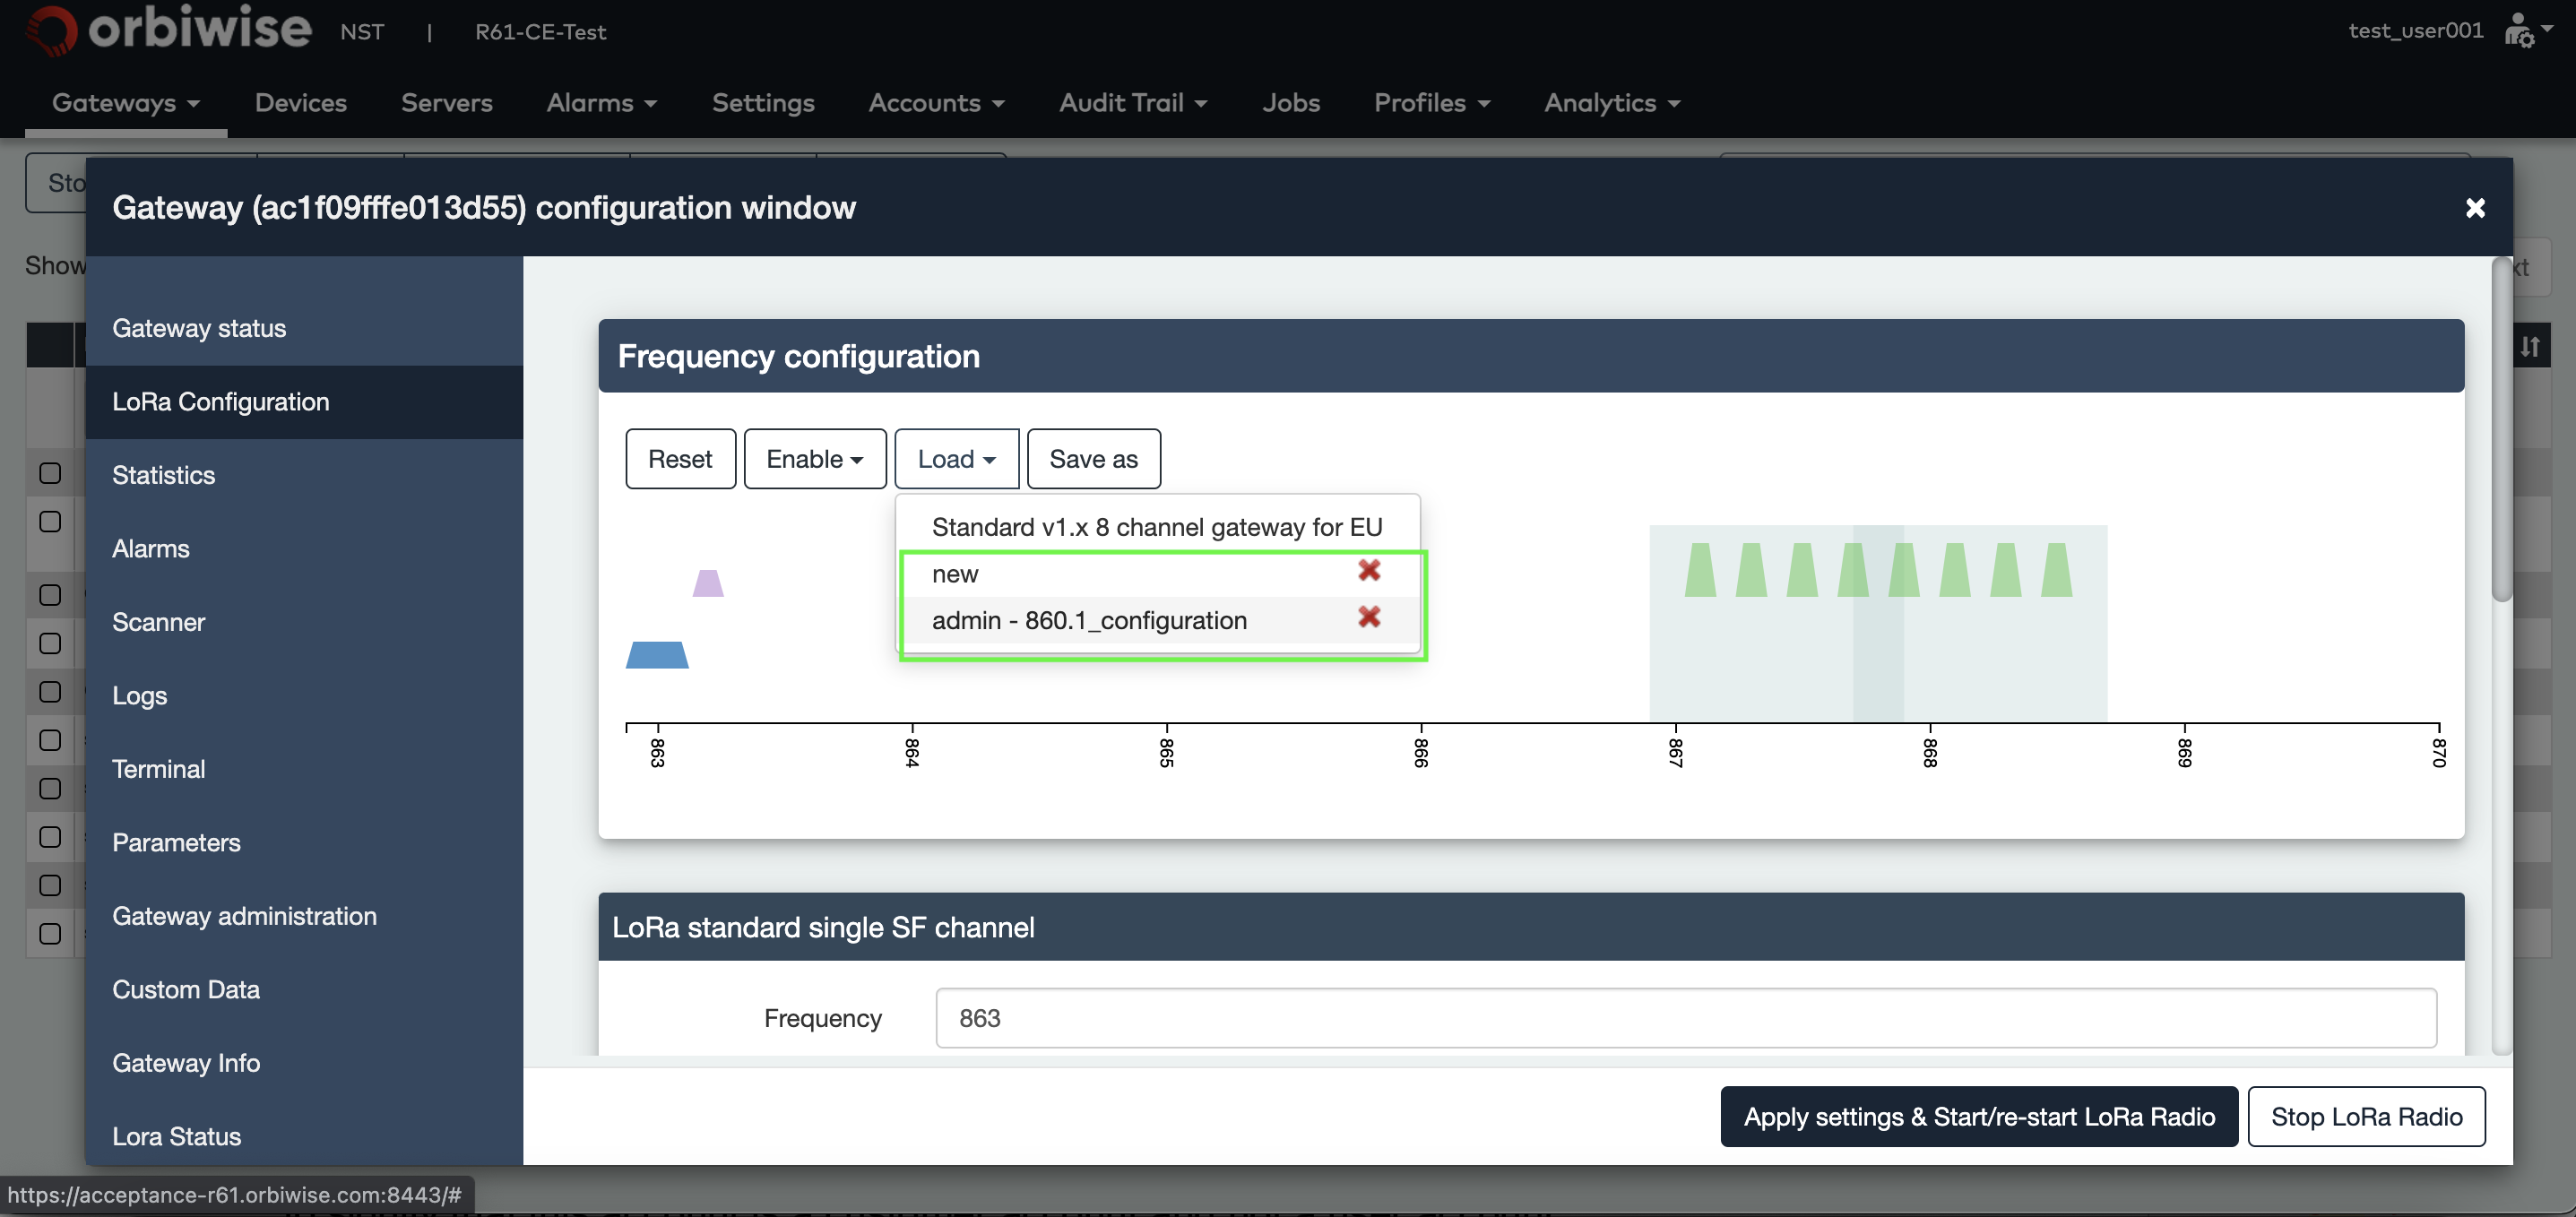
Once saved, the configuration will be available for other gateway settings. Press the Load button and a drop-down with the whole list of saved configurations will appear.
Select one and it will be displayed. Then press the start button to apply it.
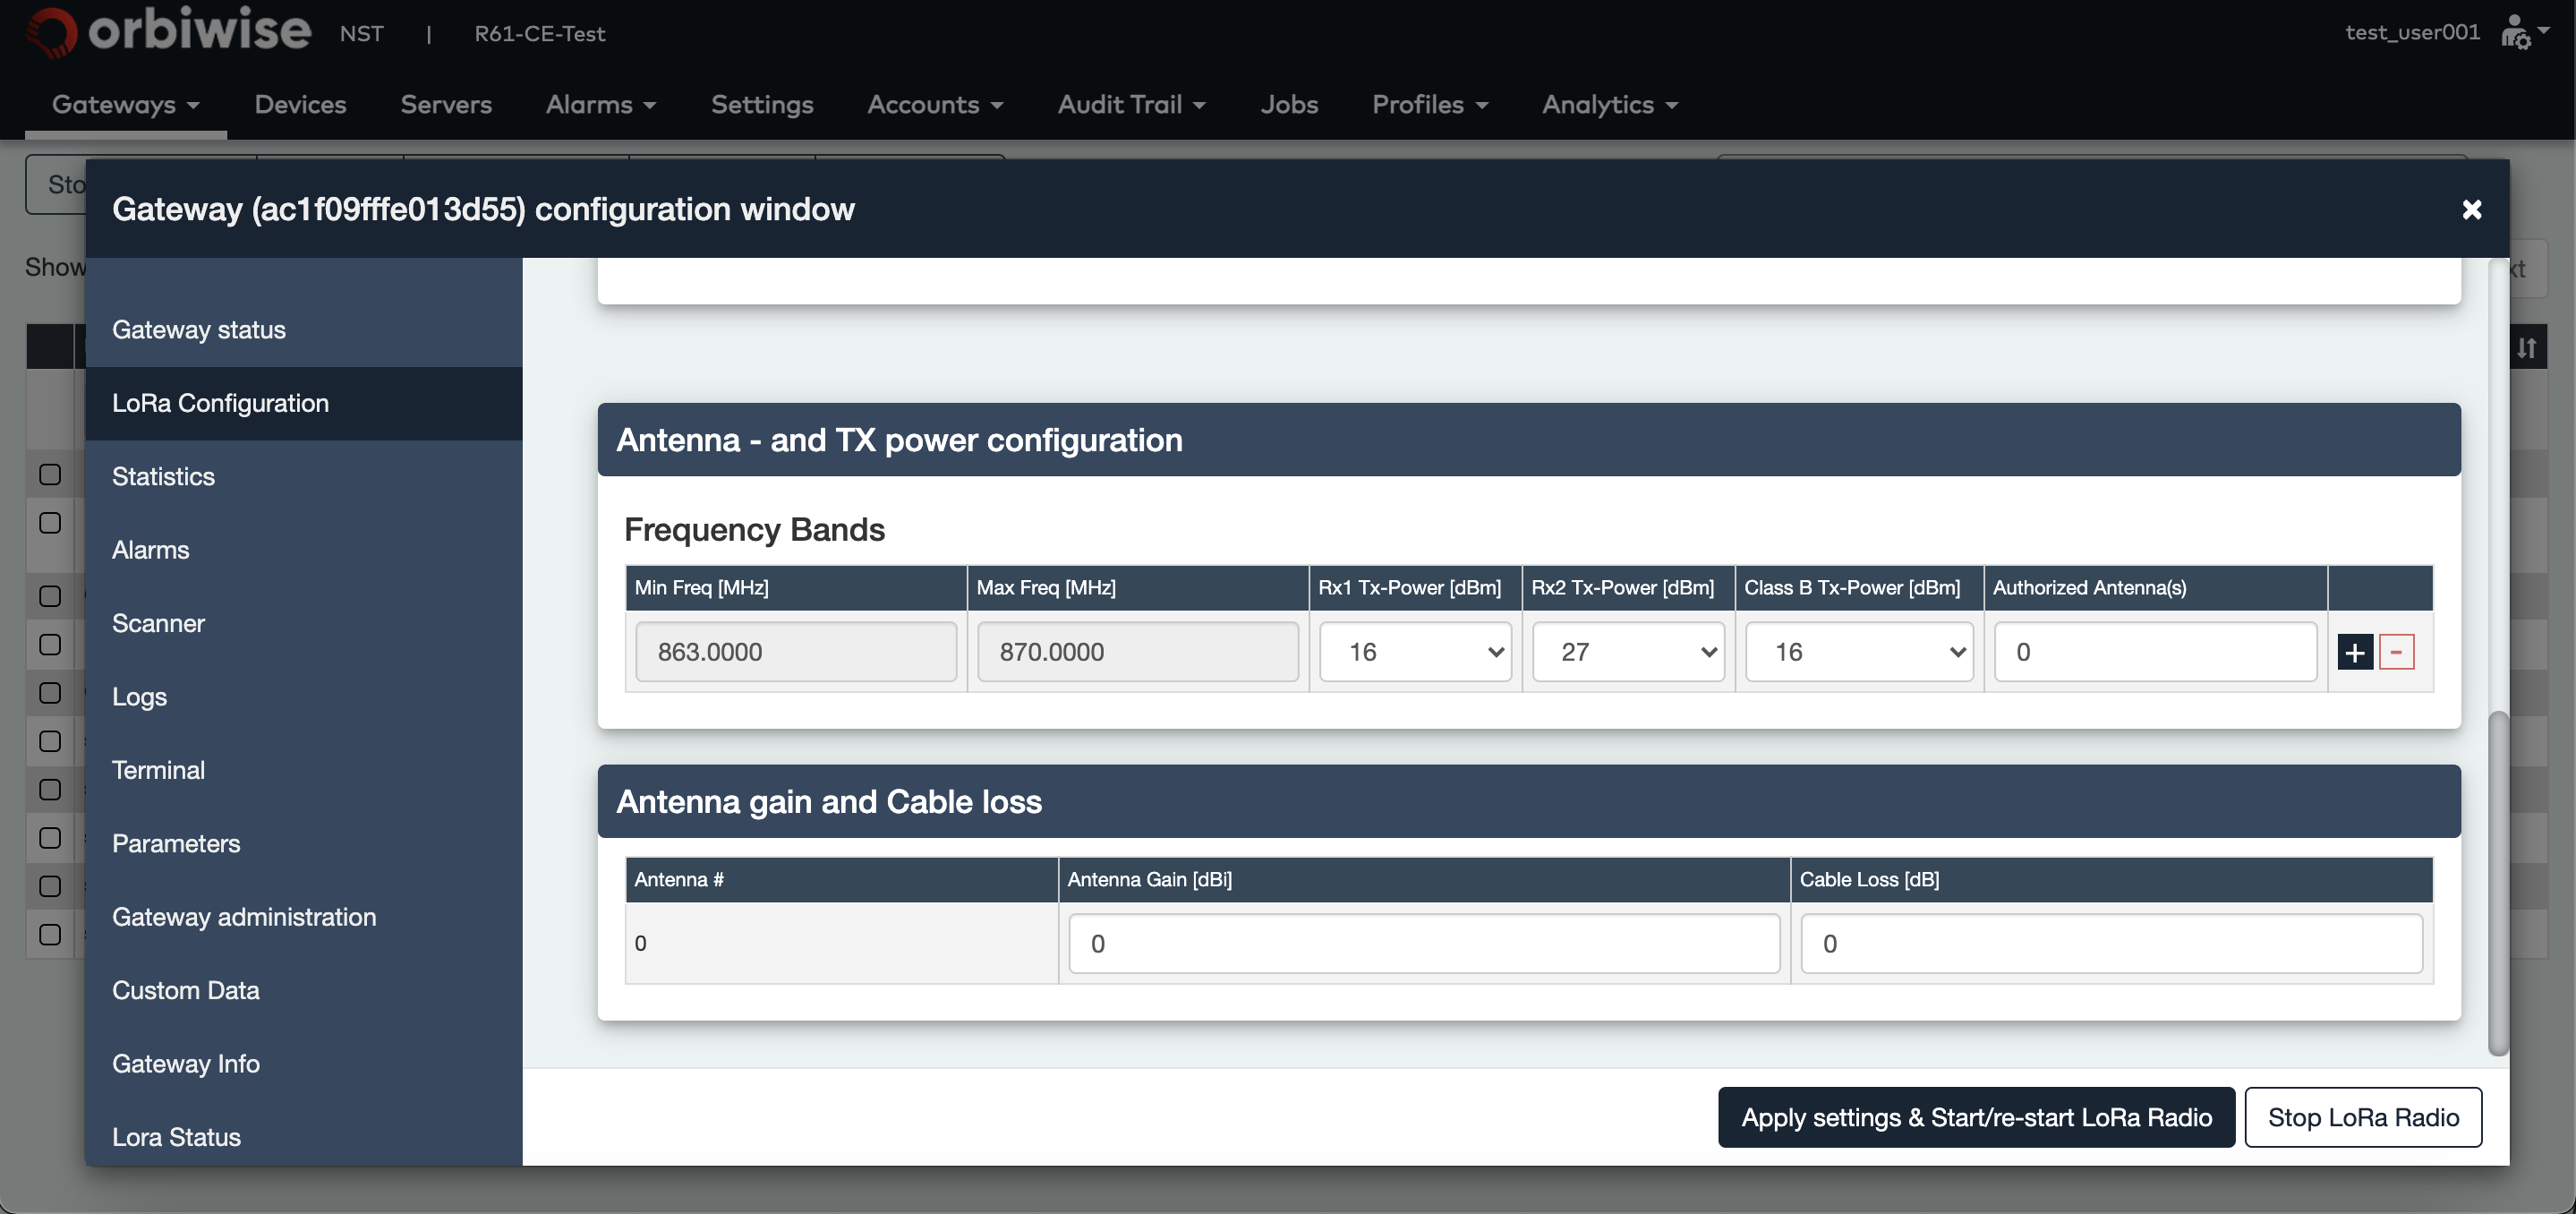
Downlink TX power, antenna gain and cable loss settings
The bottom part of the LoRa Configuration tab allows setting the following parameters, see figure below:
- Antenna and TX power configuration
- Antenna gain configuration The antenna configuration frame allows configuring the antenna gain and antenna cable loss of each potential antenna connected to the gateway. The NST allows setting the antenna parameters for as many antennas it is possible to connect on the gateway. The number of antenna connector is provided during first boot of the gateway to the O&M server. Important, if the NST displays 2 possible antenna configurations it does not mean that 2 antennas are connected to the gateway. It is up to the user to know how the gateway has been physically configured. Whenever the antenna gain configuration has been updated, the Apply settings & Start/re- start LoRa radio button shall be pressed. The antenna and TX power configuration frame allows the setting of the different TX power per sub band. The different TX power that can be set are:
- Maximum TX power for the RX1 slot downlink transmission in dBm,
- Maximum TX power for the RX2 slot or Class-C downlink transmission in dBm,
- Maximum TX power for Class-B downlink transmission in dBm.
For each sub band it is possible to indicate which of the previously defined antenna can be used for downlink transmission. Note that by default only one sub-band is defined with the different TX powers. Up to the user to add new sub-band if needed.
The network server will consider the antenna gain to adjust the effective output power to the limit of the regional regulation.
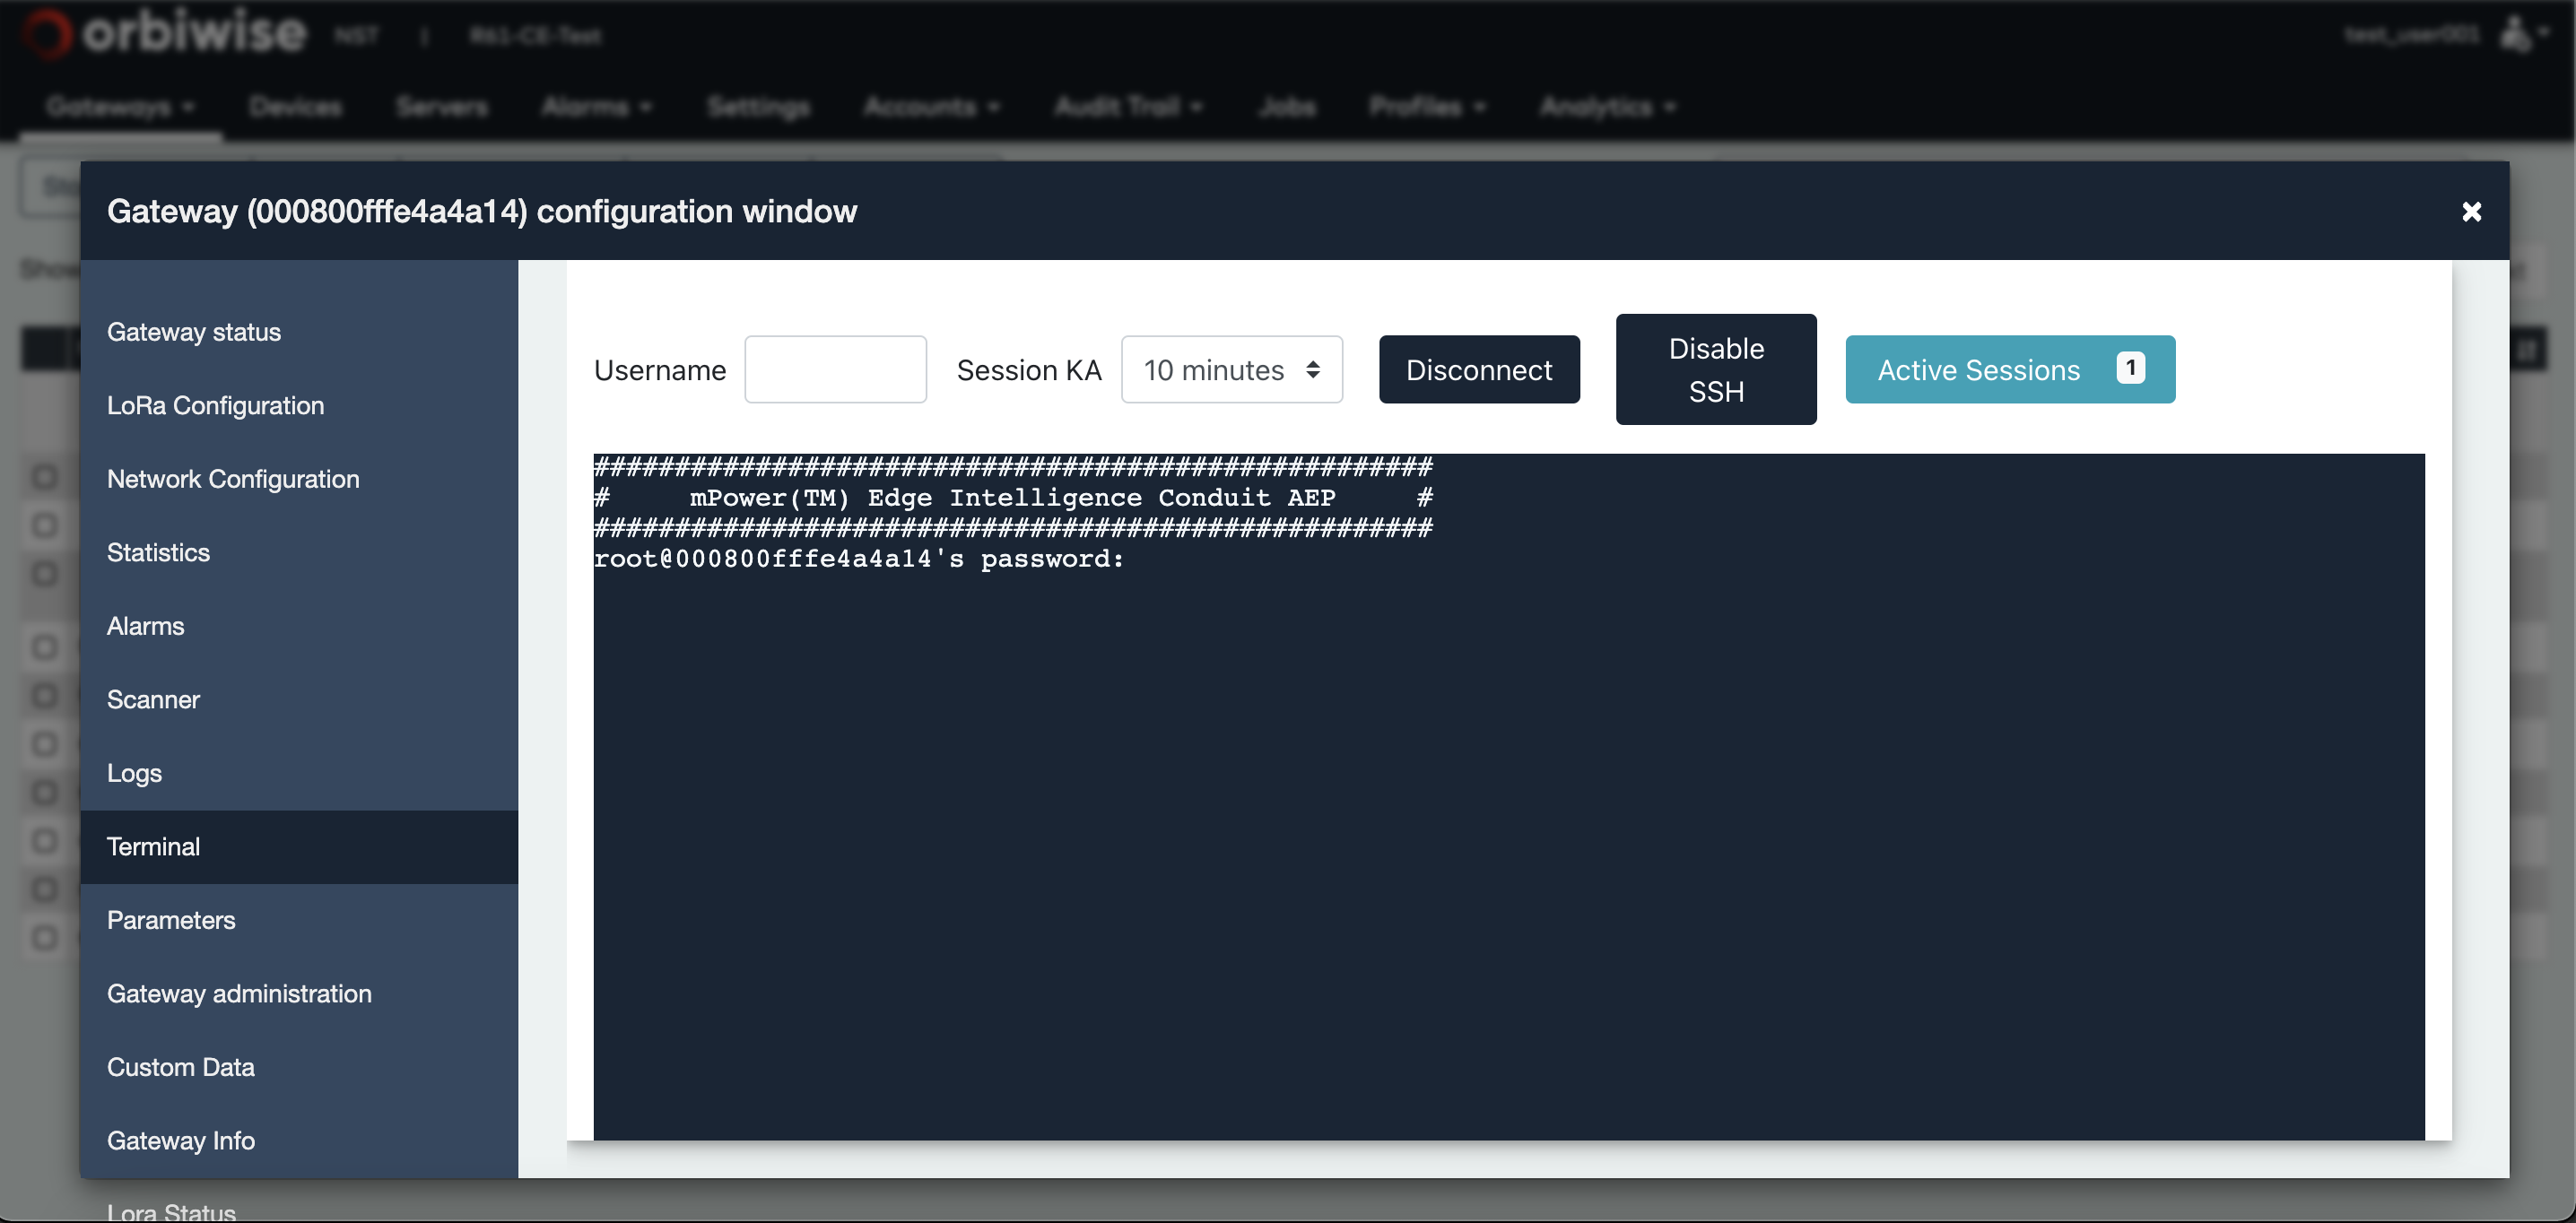
Terminal
The parameters tab of the gateway configuration window allows users to modify some gateway configuration parameters default values.
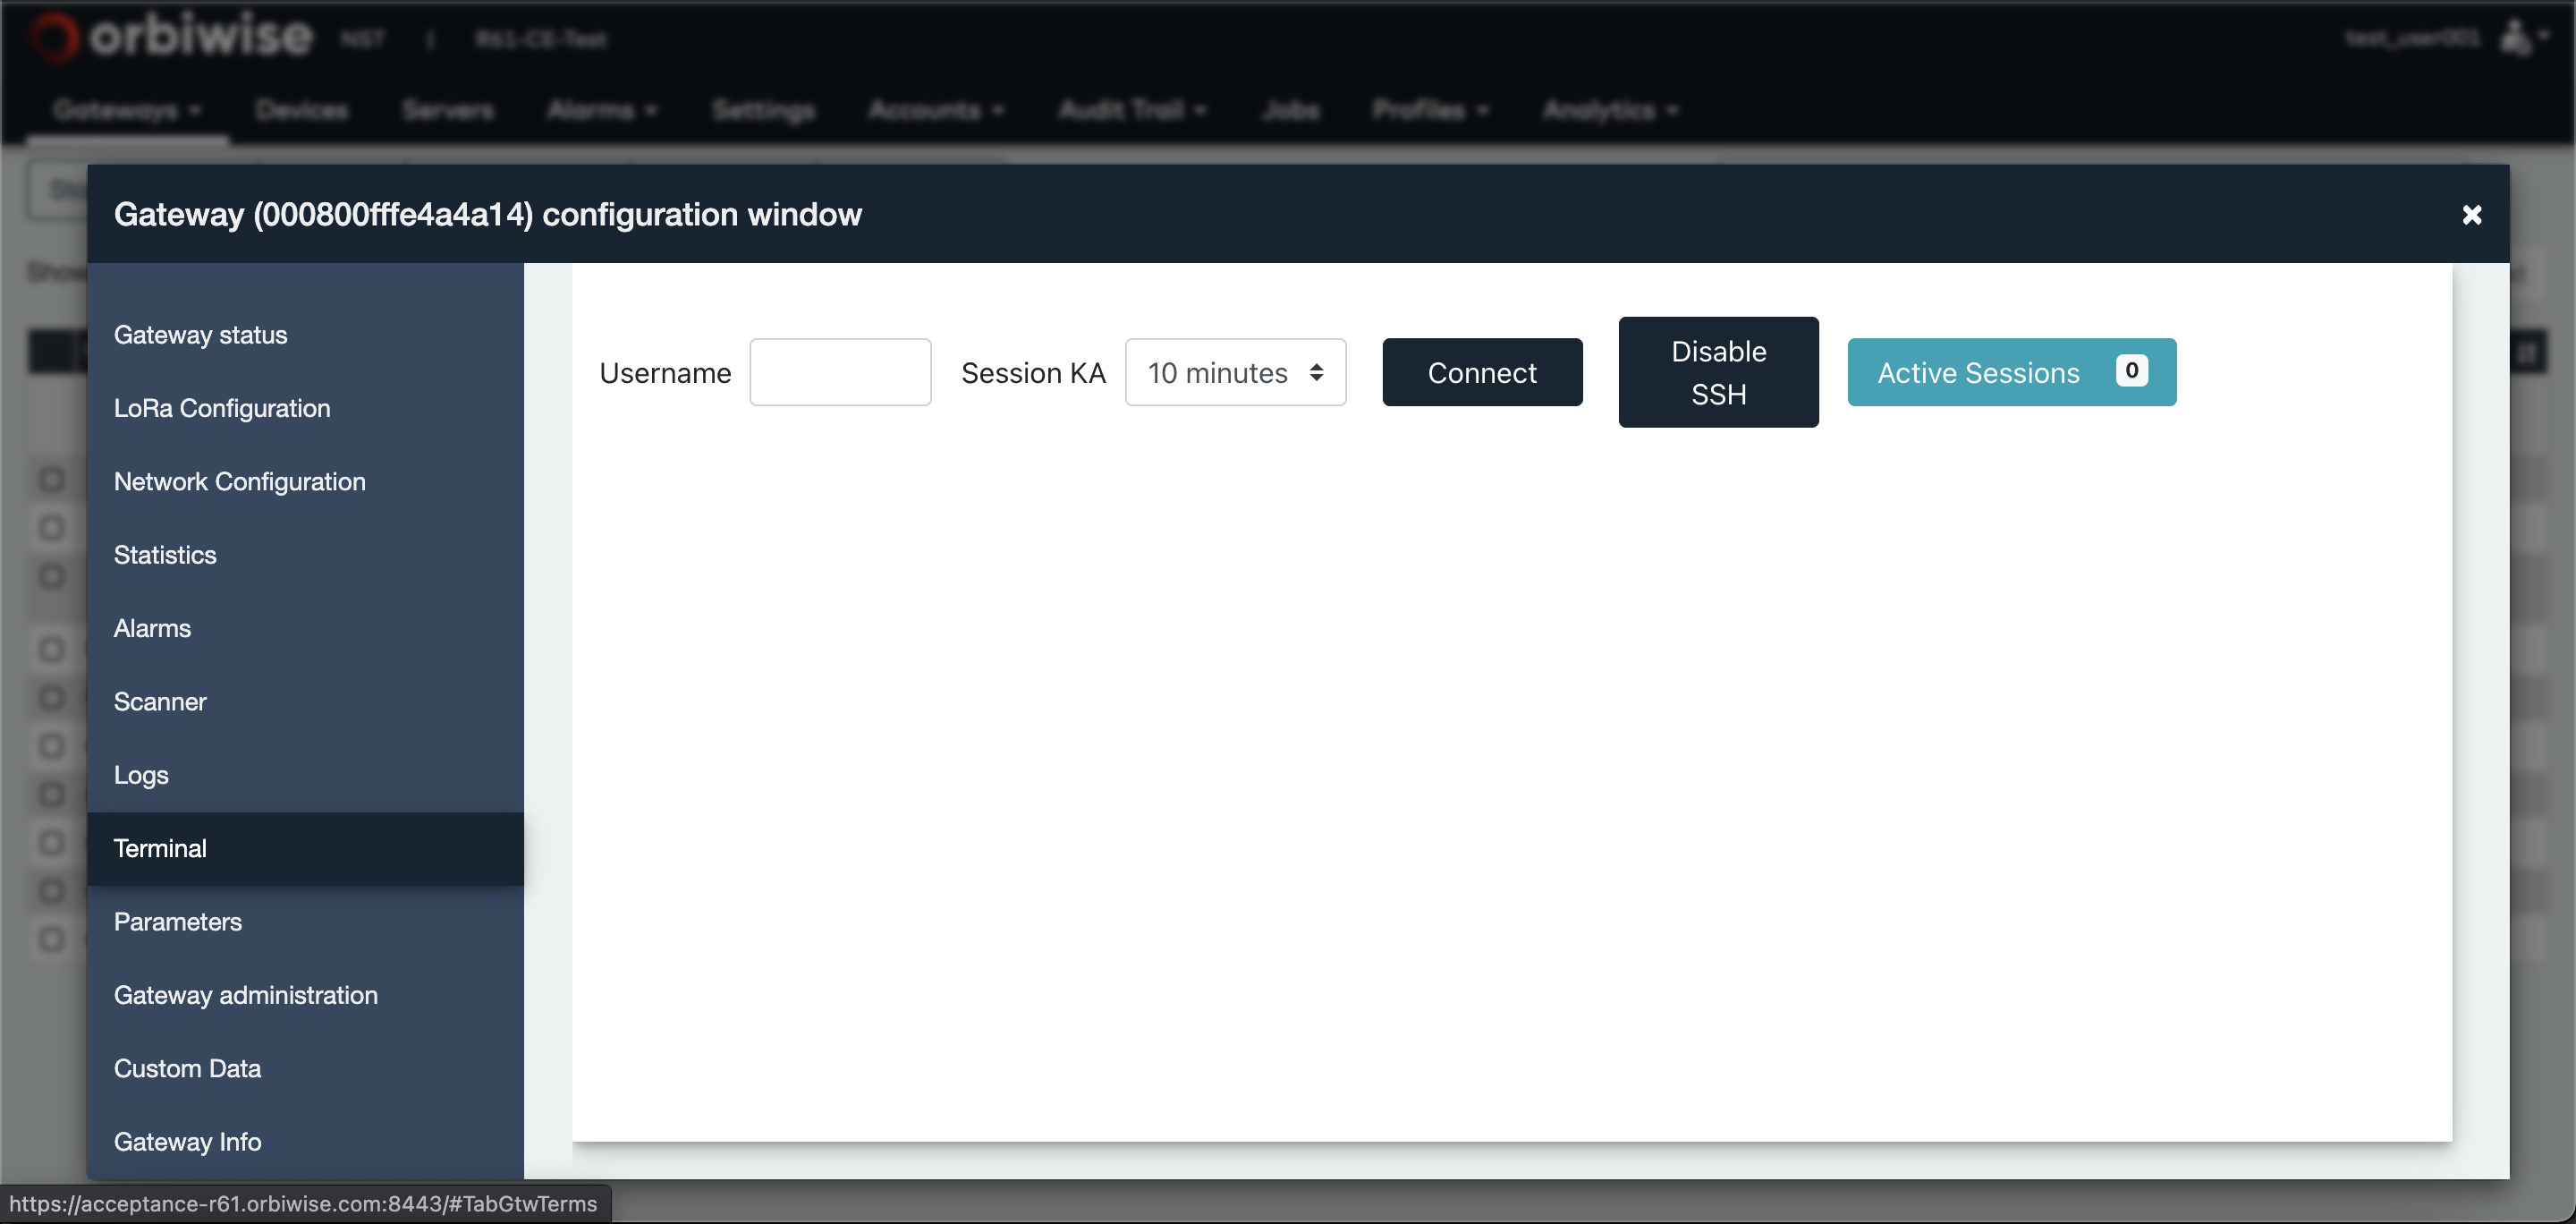
Clicking on the Connect buttong to login to the Gateway terminal. The below image shows the login screen wherein it requires to enter the password of the gateway.
Gateway Scanner
OrbiWAN supports a gateway scanner feature. This feature allows performing rough received signal level (in dBm) on a predefined band, step by step. Repeating the measurement on the band several times (Scanner sweeps) allows making an evaluation of the interferer level in the band. Whenever some frequencies are interfered with, it might be advised to avoid using those and select alternative frequencies instead. OrbiWAN currently supports two scanner modes:
-
Parallel scanning: the scanner is running in parallel of LoRa packet reception. So scanner has no impact on the on-going real-time traffic.
-
Standard scanning: In this mode, the radio used for end-device traffic reception is reconfigured in scan mode. No real-time traffic can be received.
The support of the scanner function and the mode of scanner that can be used by a gateway is dependent on the gateway hardware.
| Gateway Type | Scanner Support | Scanner Mode |
|---|---|---|
| Orbiwise Nano-Gateway v3 | Yes | Standard |
| Orbiwise Nano-Gateway v3 | Yes | Standard/Parallel (*) |
| Kerlink v1 (20dBm LoRa station) | Yes | Standard |
| Kerlink v1 (27dBm LoRa station) | Yes | Standard |
| Kerlink v2 | Yes | Standard/Parallel(*) |
| Cisco | Yes | Standard/Parallel |
| Gemtech GioT | No | - |
| Gemtech | No | - |
| MultiTech Multiconnect Conduit | No | - |
| Tektelic pico-gateway | No | - |
By default, whenever supported, parallel scanning is used since it does not block normal traffic (except for Japan, read note below).
Note: For the Japan region where the Listen Before Talk feature is mandatory, having the scanner running in parallel of normal LoRa packet reception would force disabling of LBT (Semtech Hardware design constraint). So, for the Japan region, whenever the scanner is enabled it is in standard mode.
The below table shows the default band scanned depending on the region.
| Region | Start (MHz) | End (MHz) |
|---|---|---|
| EU868 | 863 | 870 |
| US915 | 902 | 928 |
| IN865 | 863 | 870 |
| AS923 | 915 | 928 |
To Start/Stop a gateway scanner please refer to the image below:
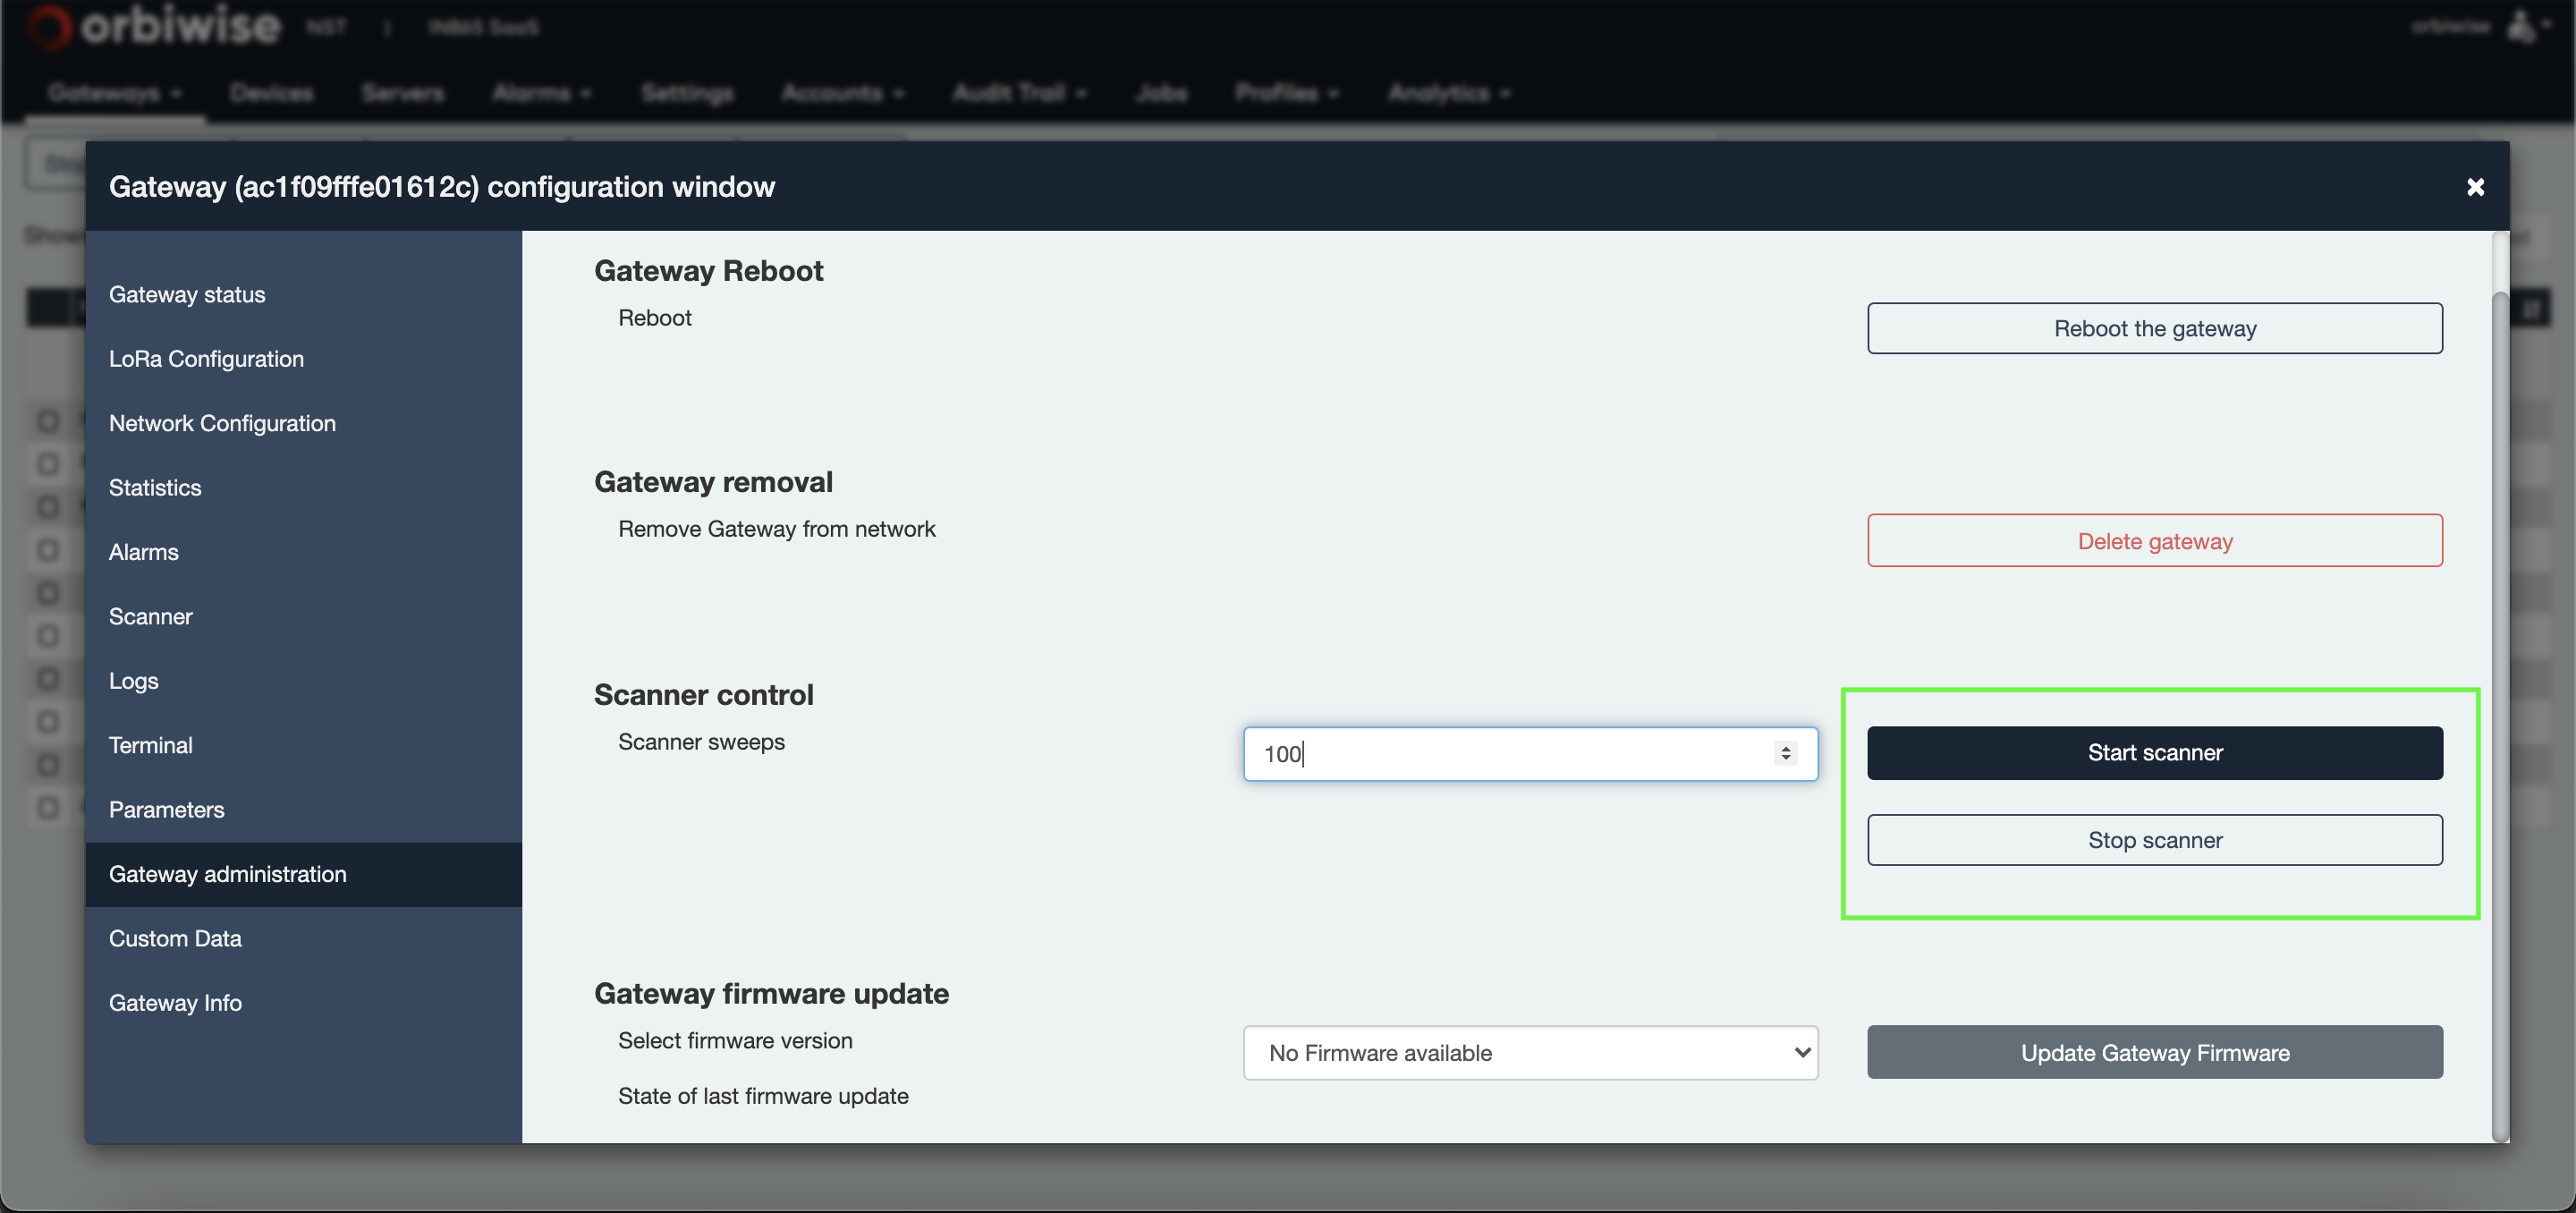
Figure below shows the result of a gateway scan. The result page is accessed selecting the tab Scanner of the gateway configuration window.
Results are stored in files that can be selected on the left side of the figure. Selecting one file will show the result of the scan for this file.
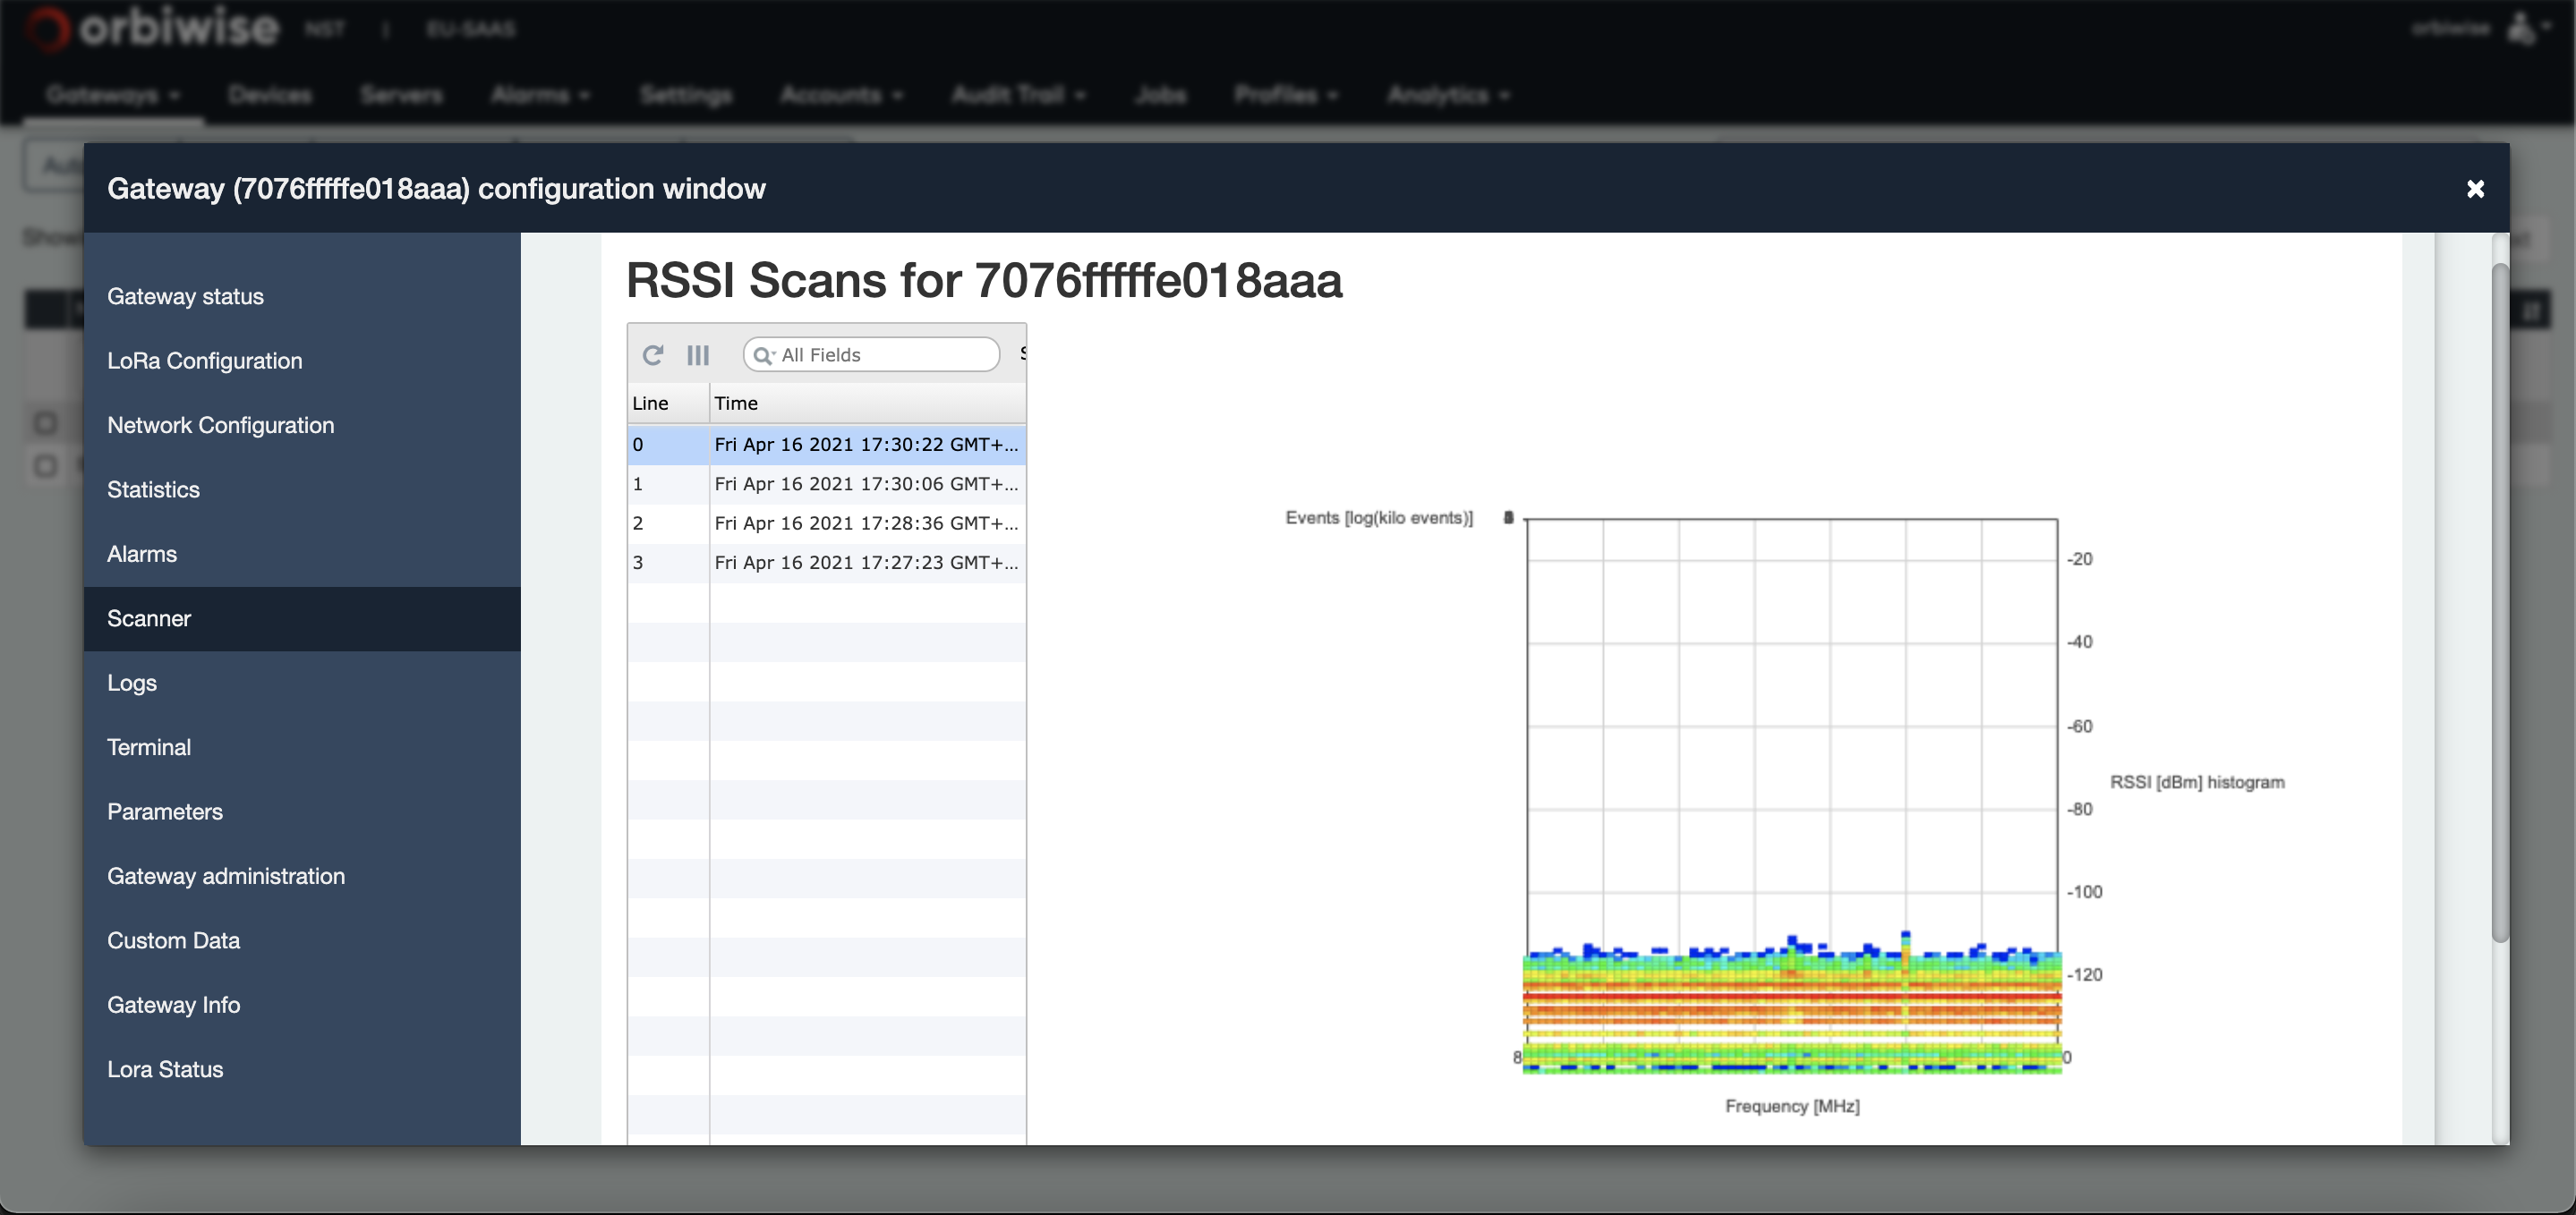
Selecting several files will display the cumulated results of the selected files.
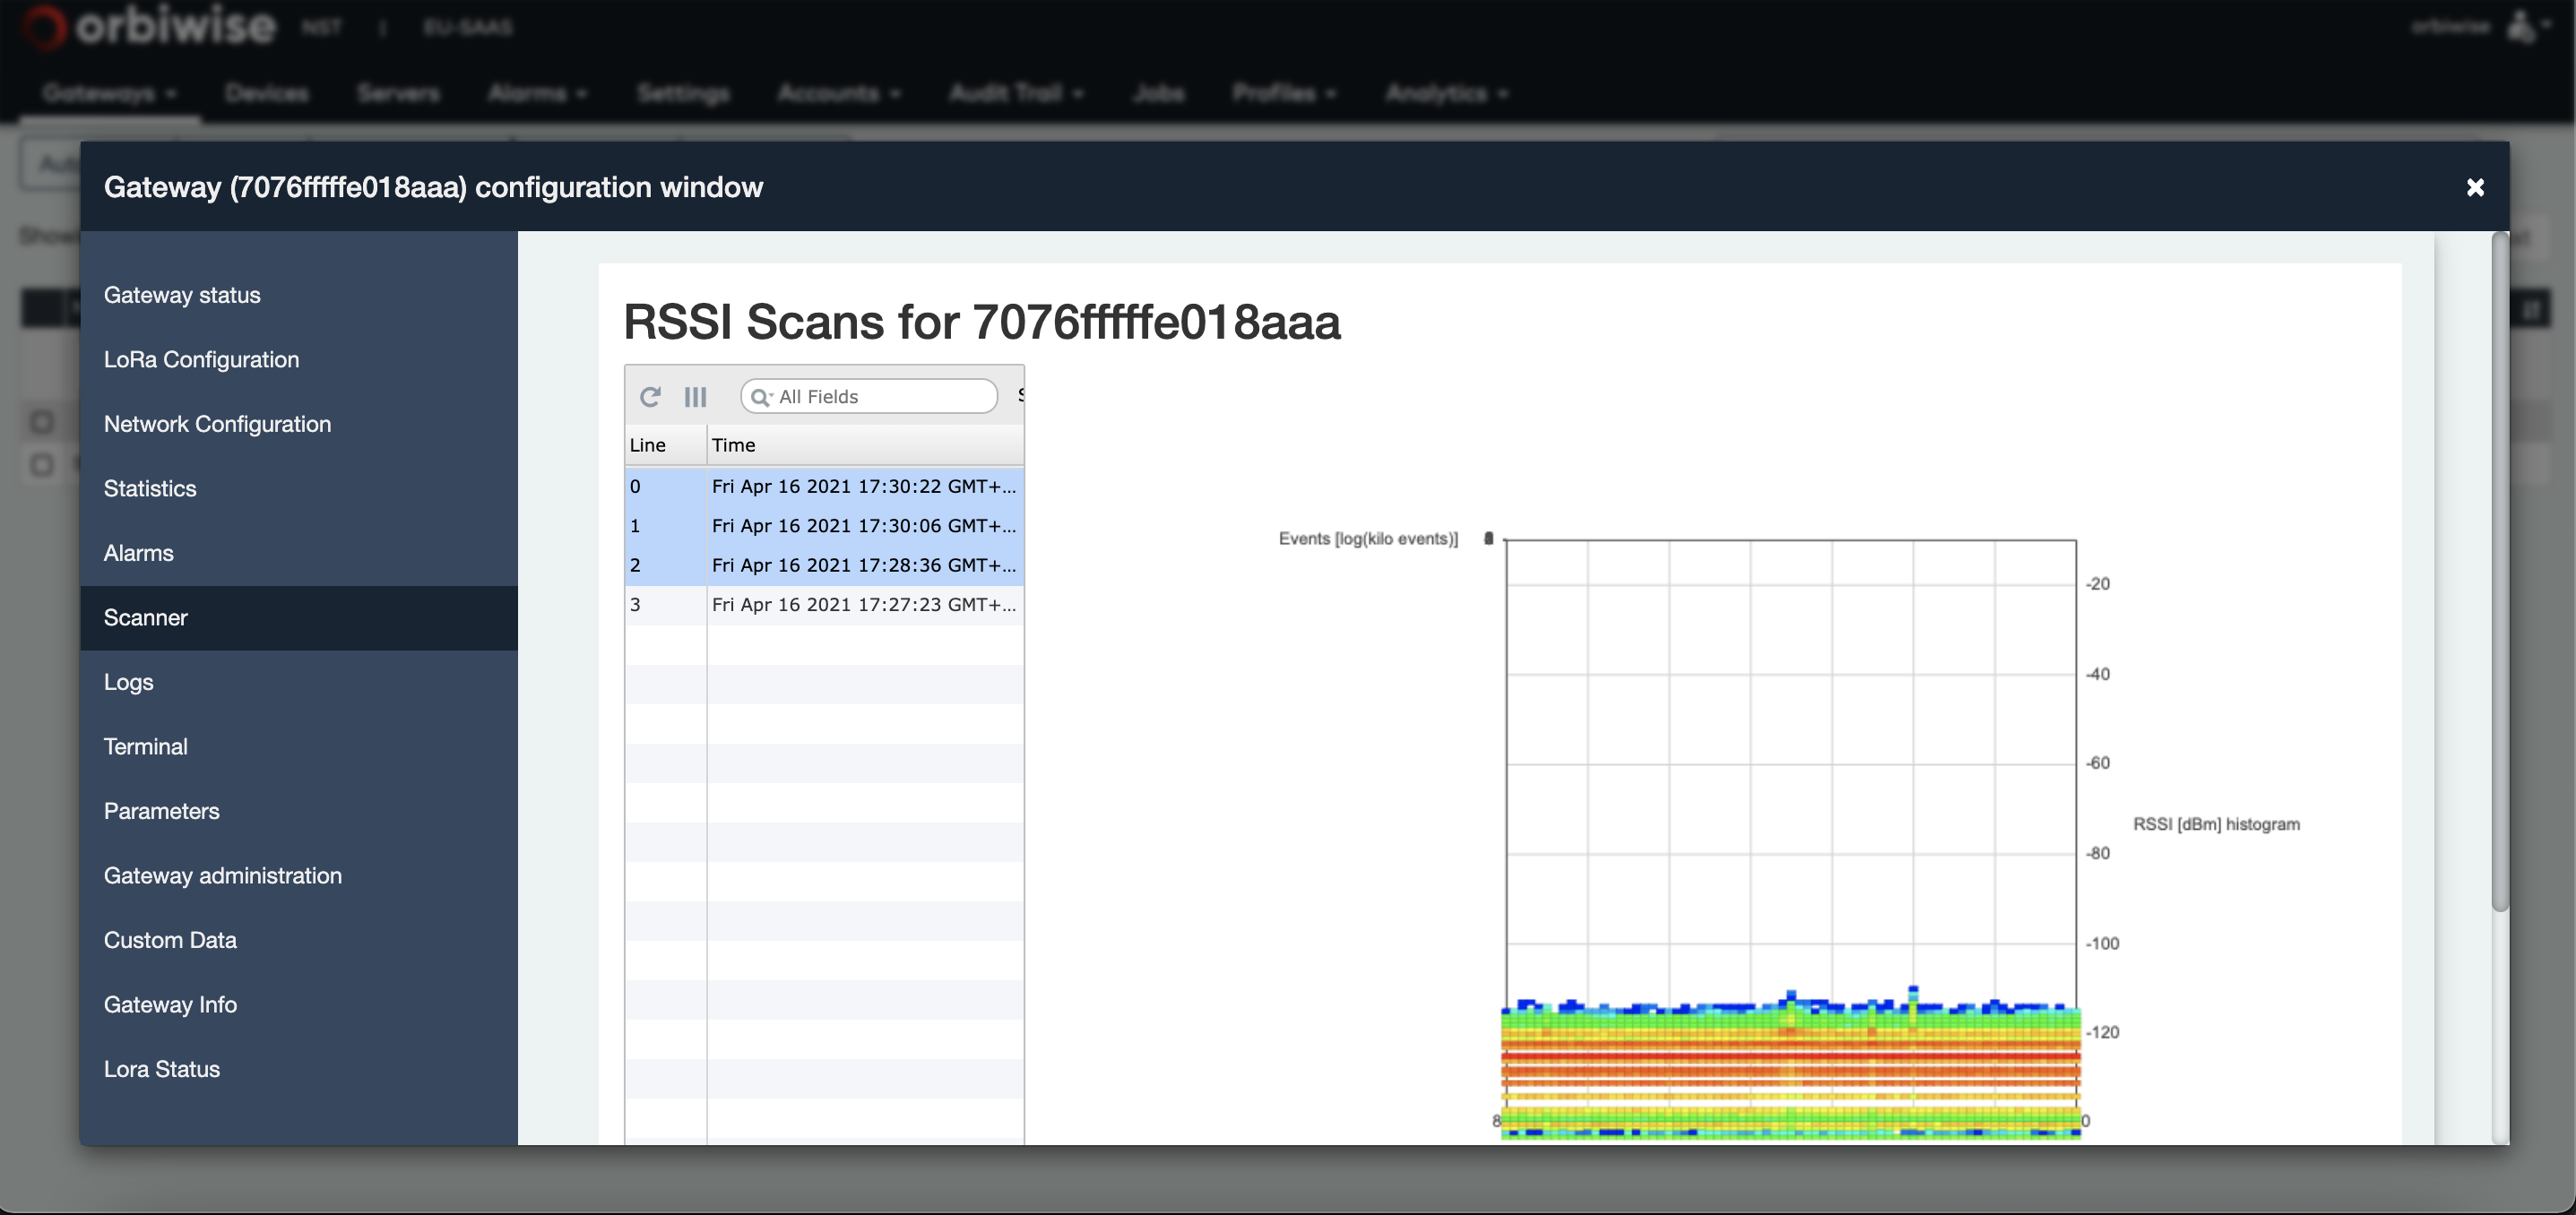
By selecting the graph on the right side of the figure, it is possible to turn it in order to obtain the 3D representation of it.
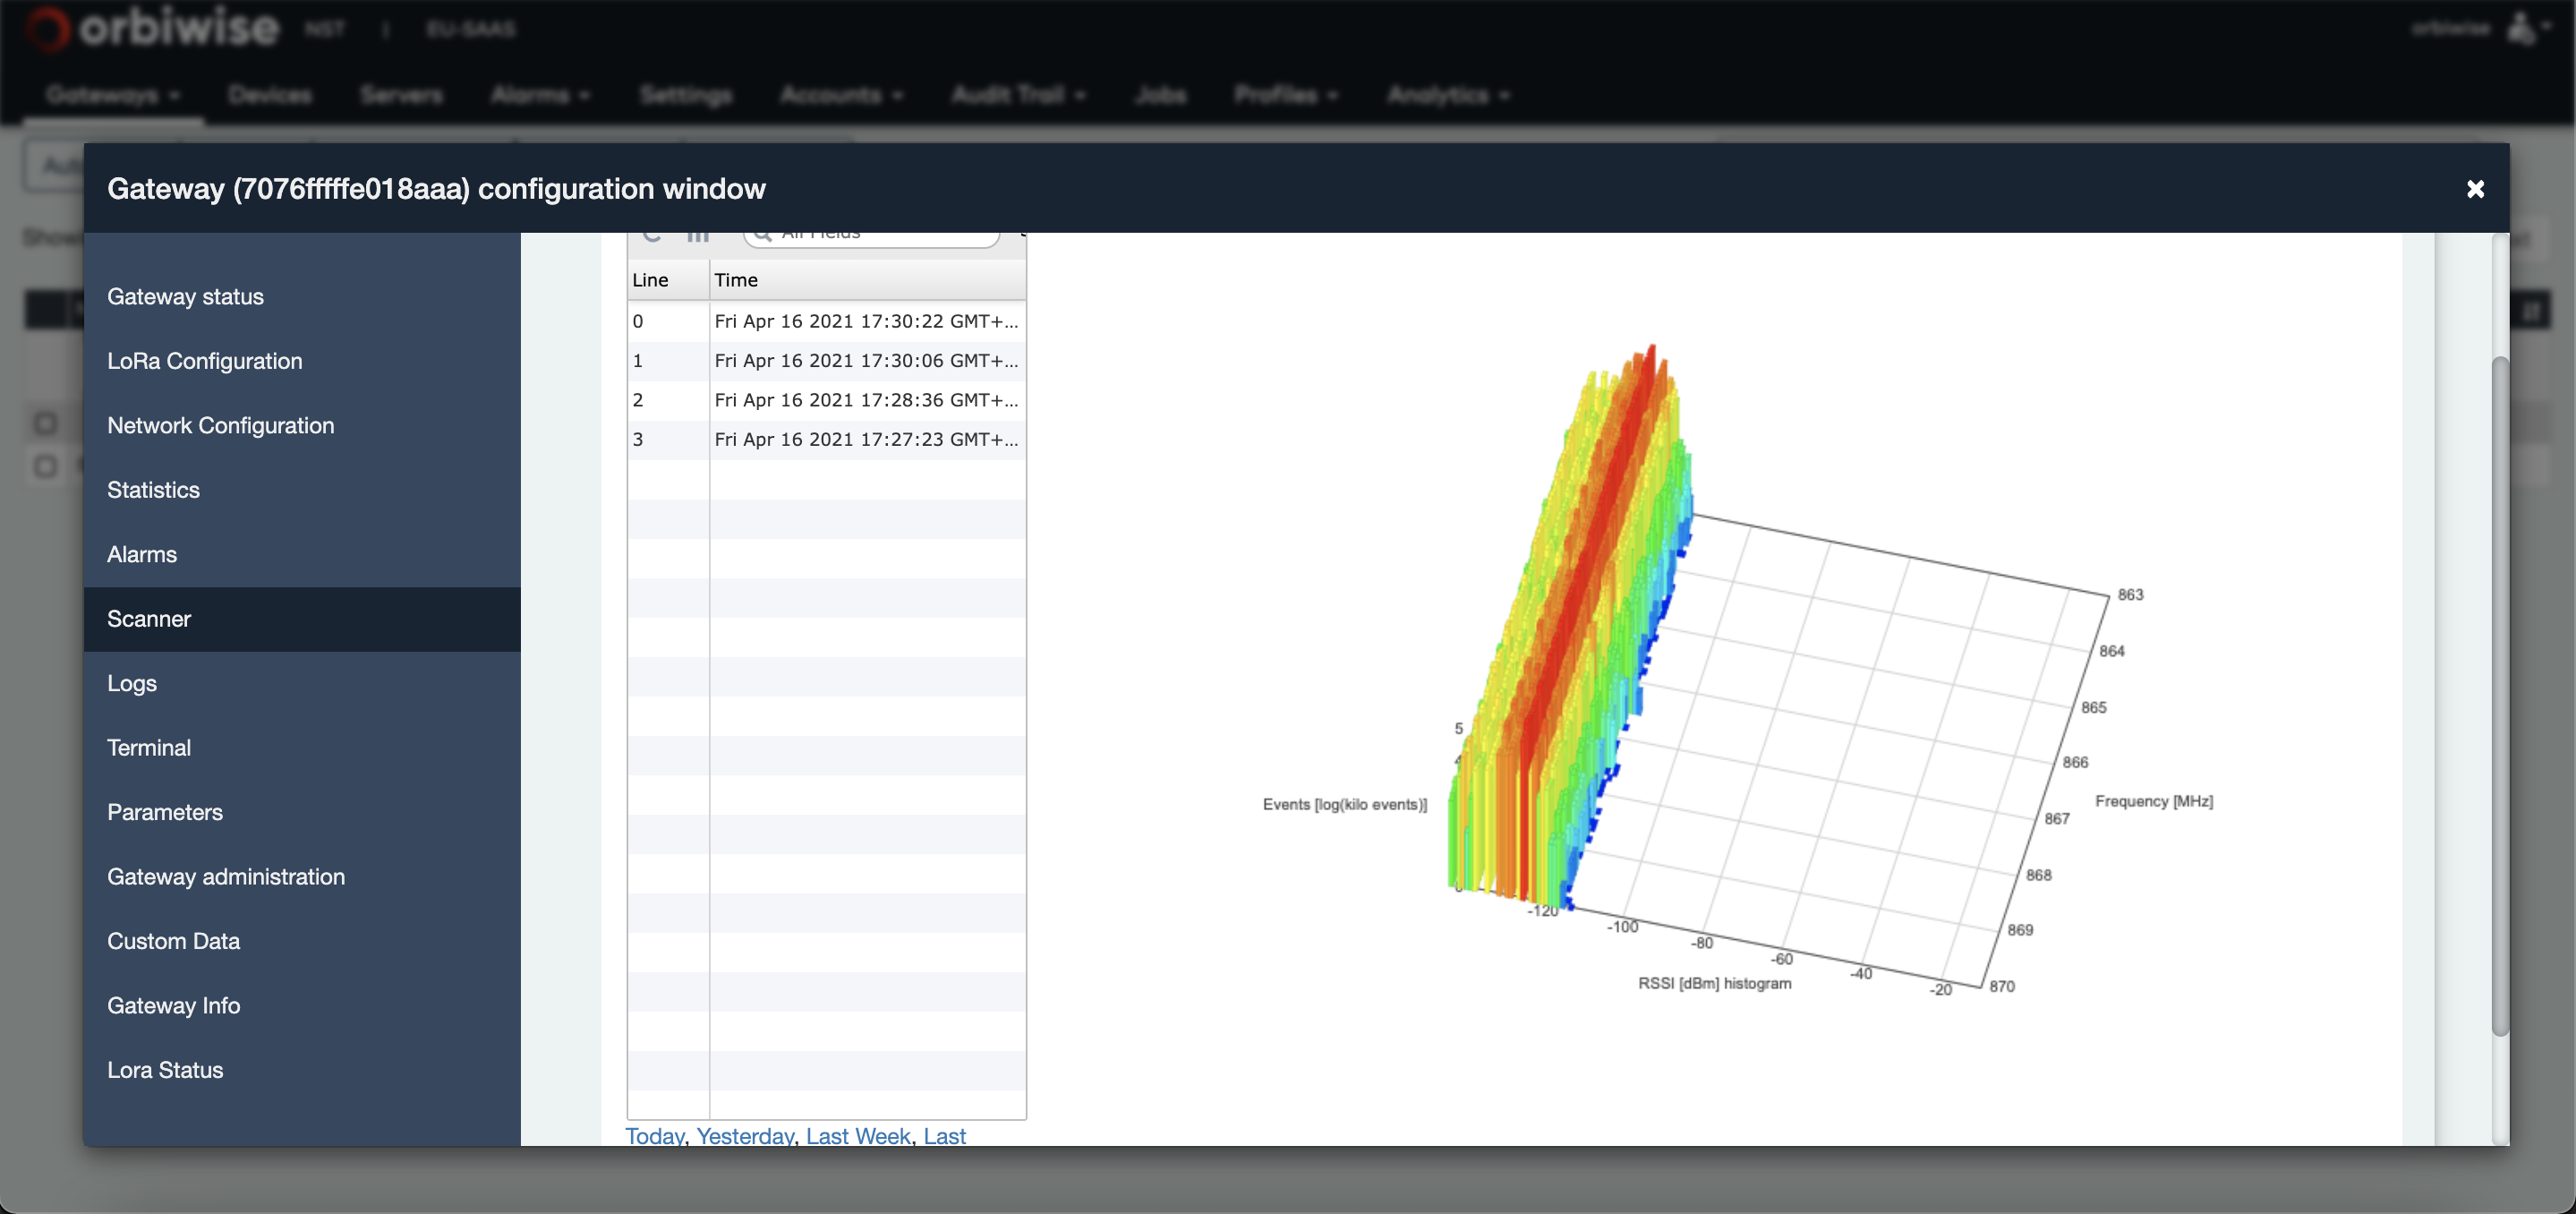
The plan RSSI/Frequency provides the RSSI measurement values in dBm for the different frequencies that have been measured in the band.
The Z-Axis (in log(k events)) indicates the number of times (event) one paired frequency/RSSI has been measured. The red bar, measured on the whole band at around -110 dBm, represents the noise floor.
Log Scanner
The Logs tab gives access to a user interface allowing the downloading of gateway logs file on local machine and also to perform some analysis of the logs file as shown below:
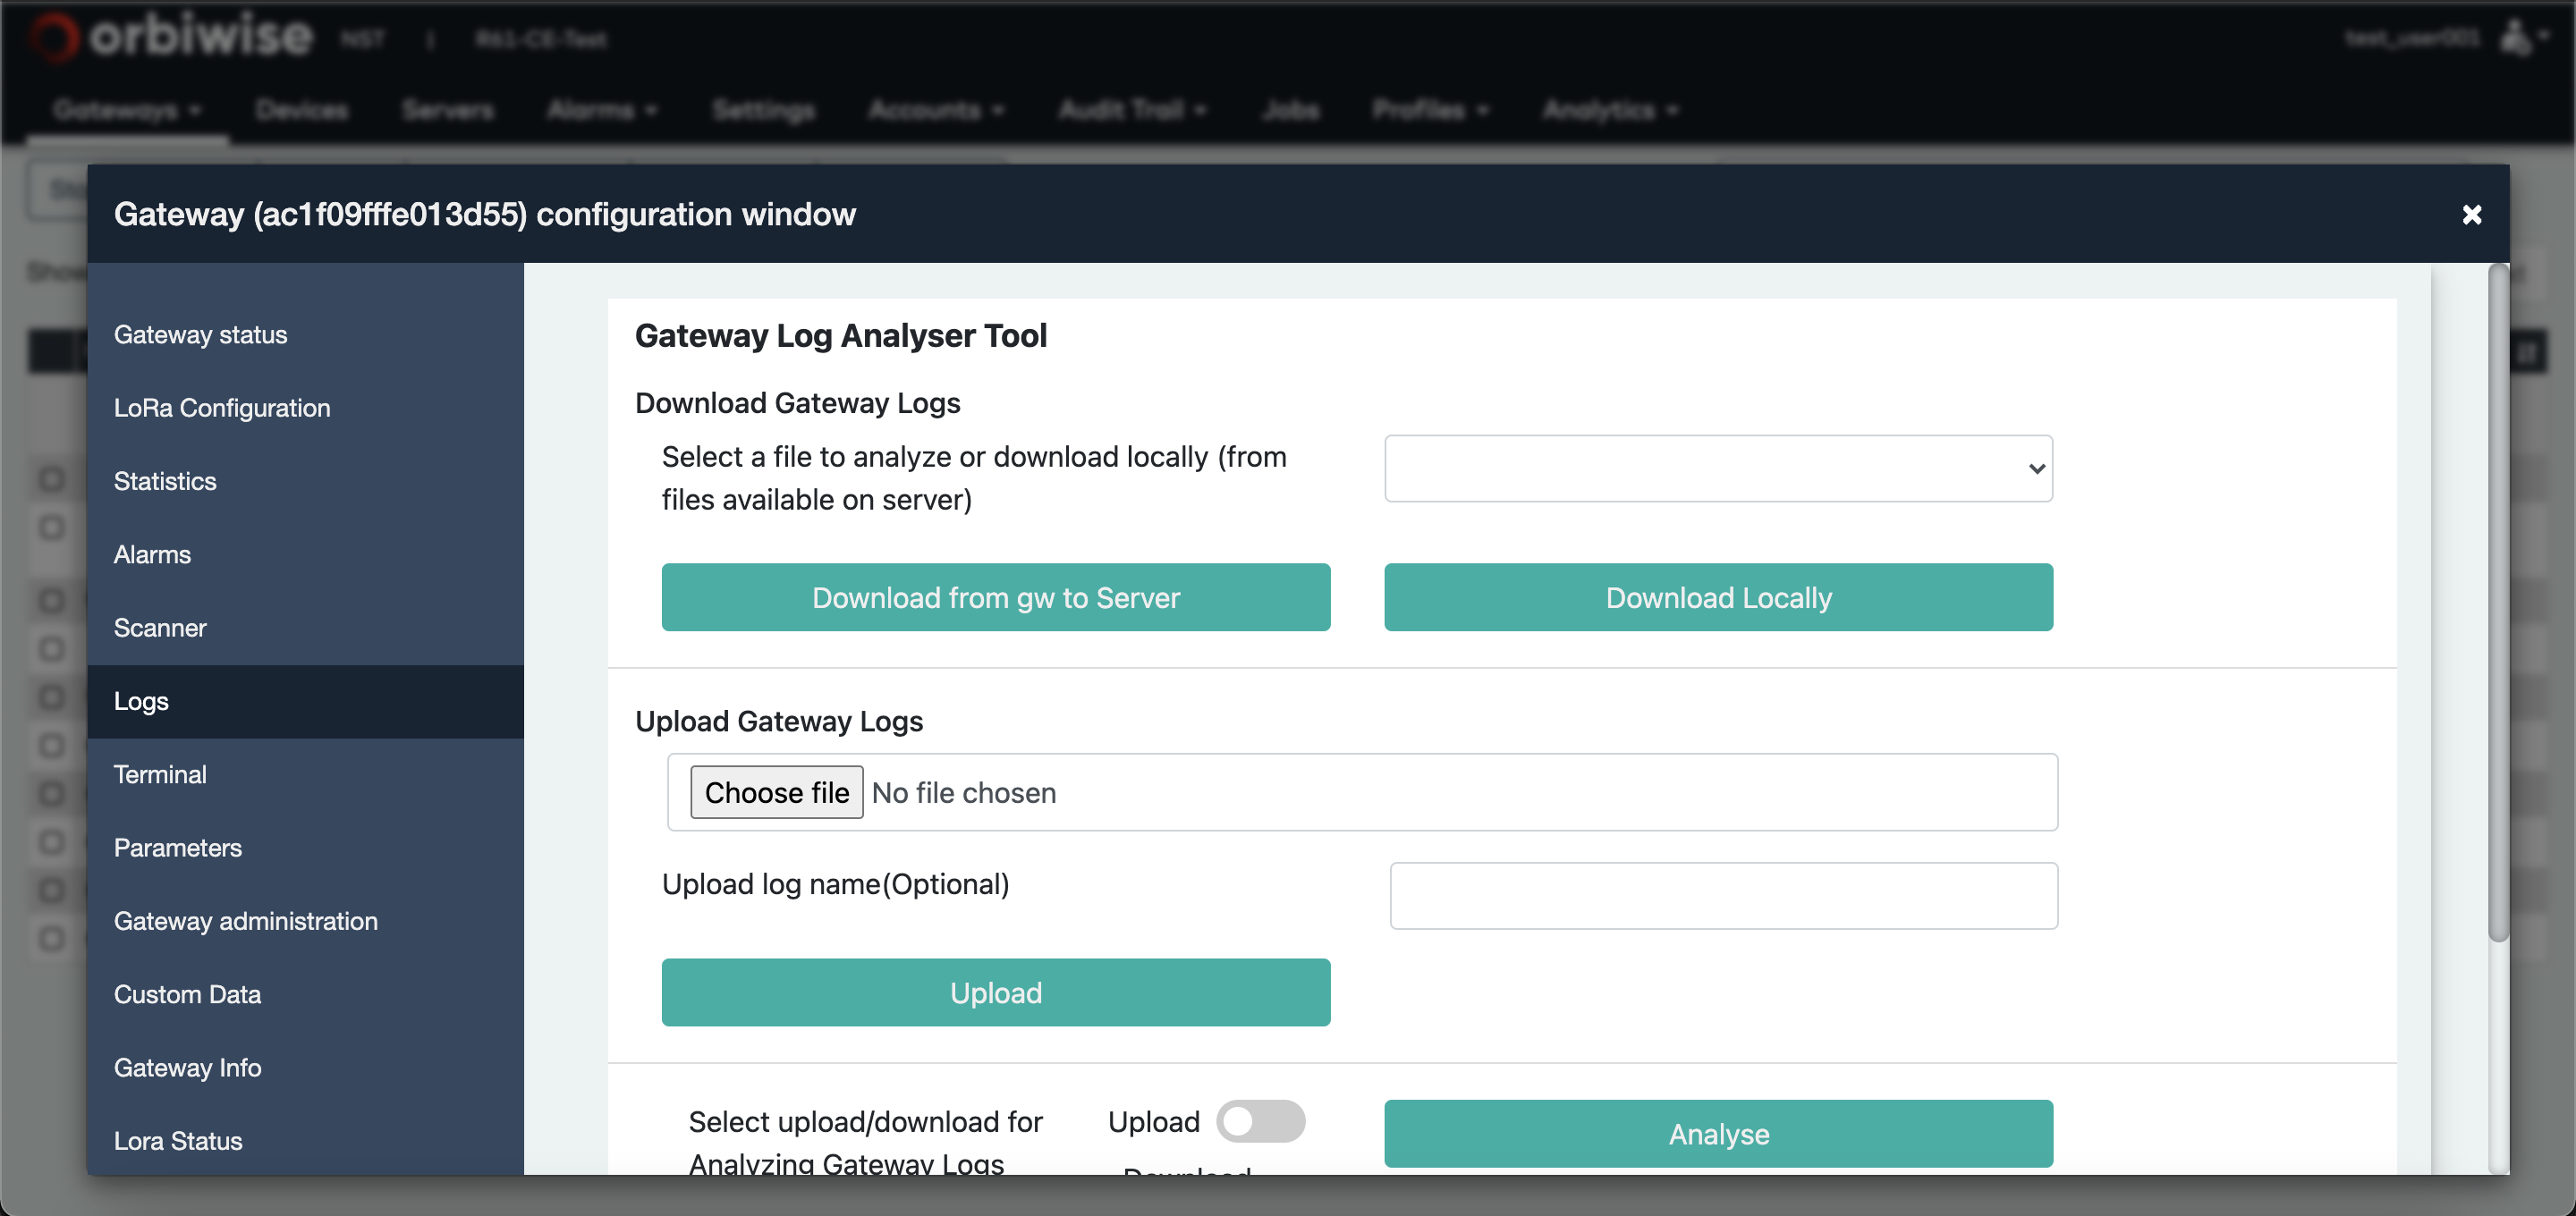
First step will consist in downloading the gateway logs to the gateway log server by pressing the Download from gateway to server button. Then download of the log file to the server will start and user should see progress as in the figure below:
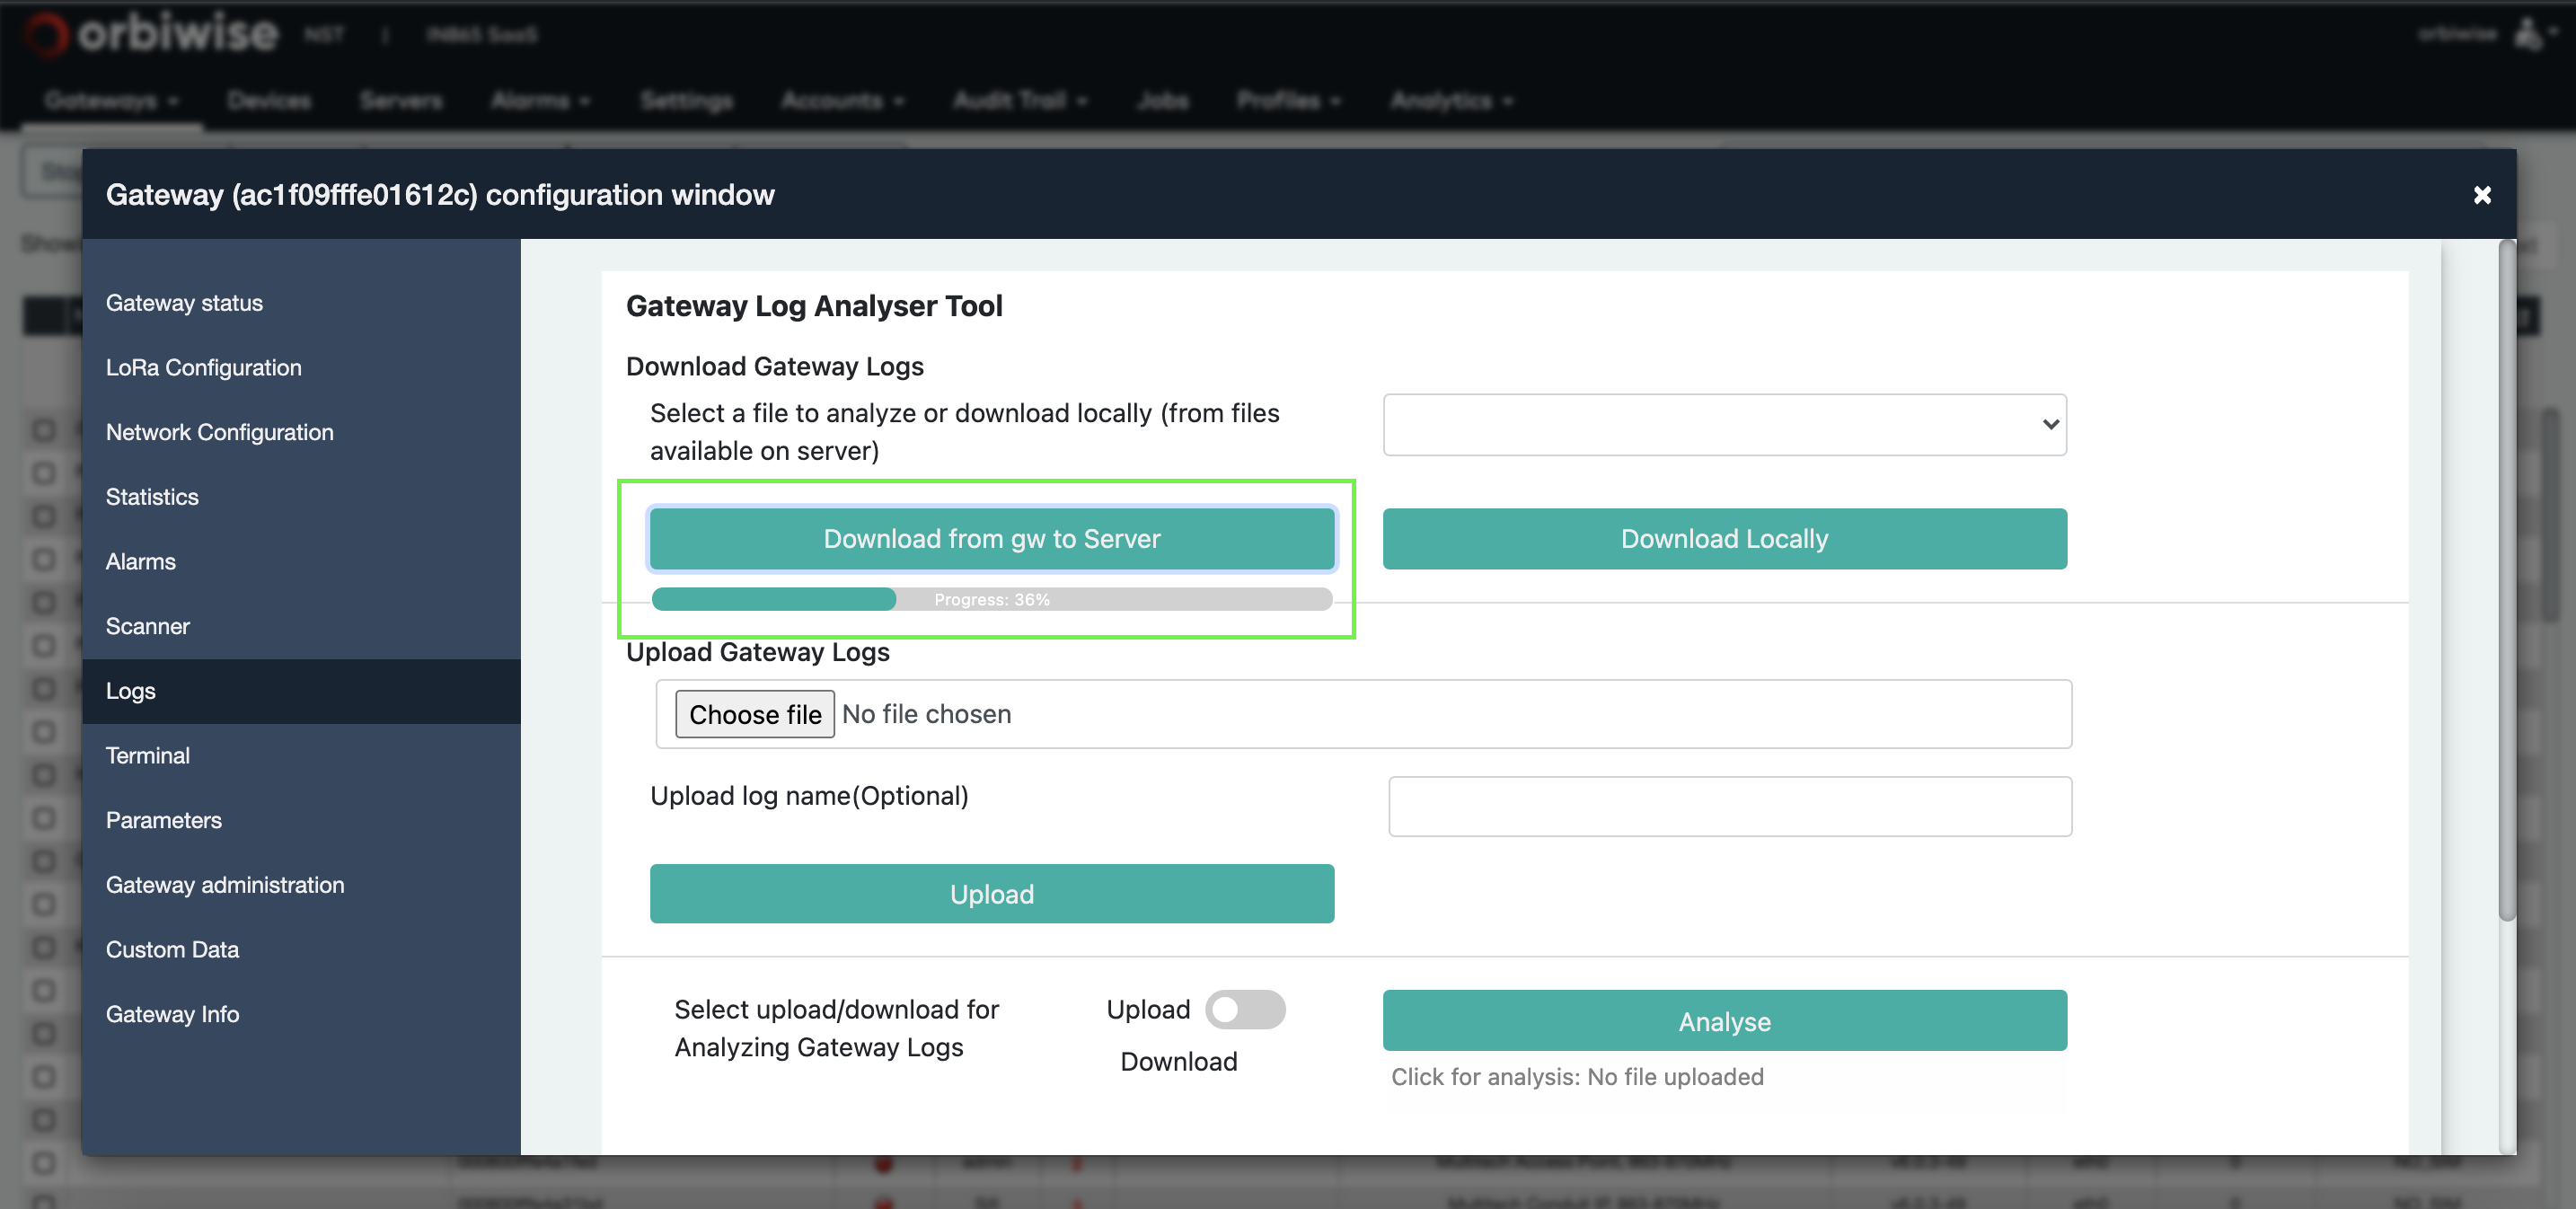
Once the transfer is finished, the log file will be listed in the drop down table as in the figure below:
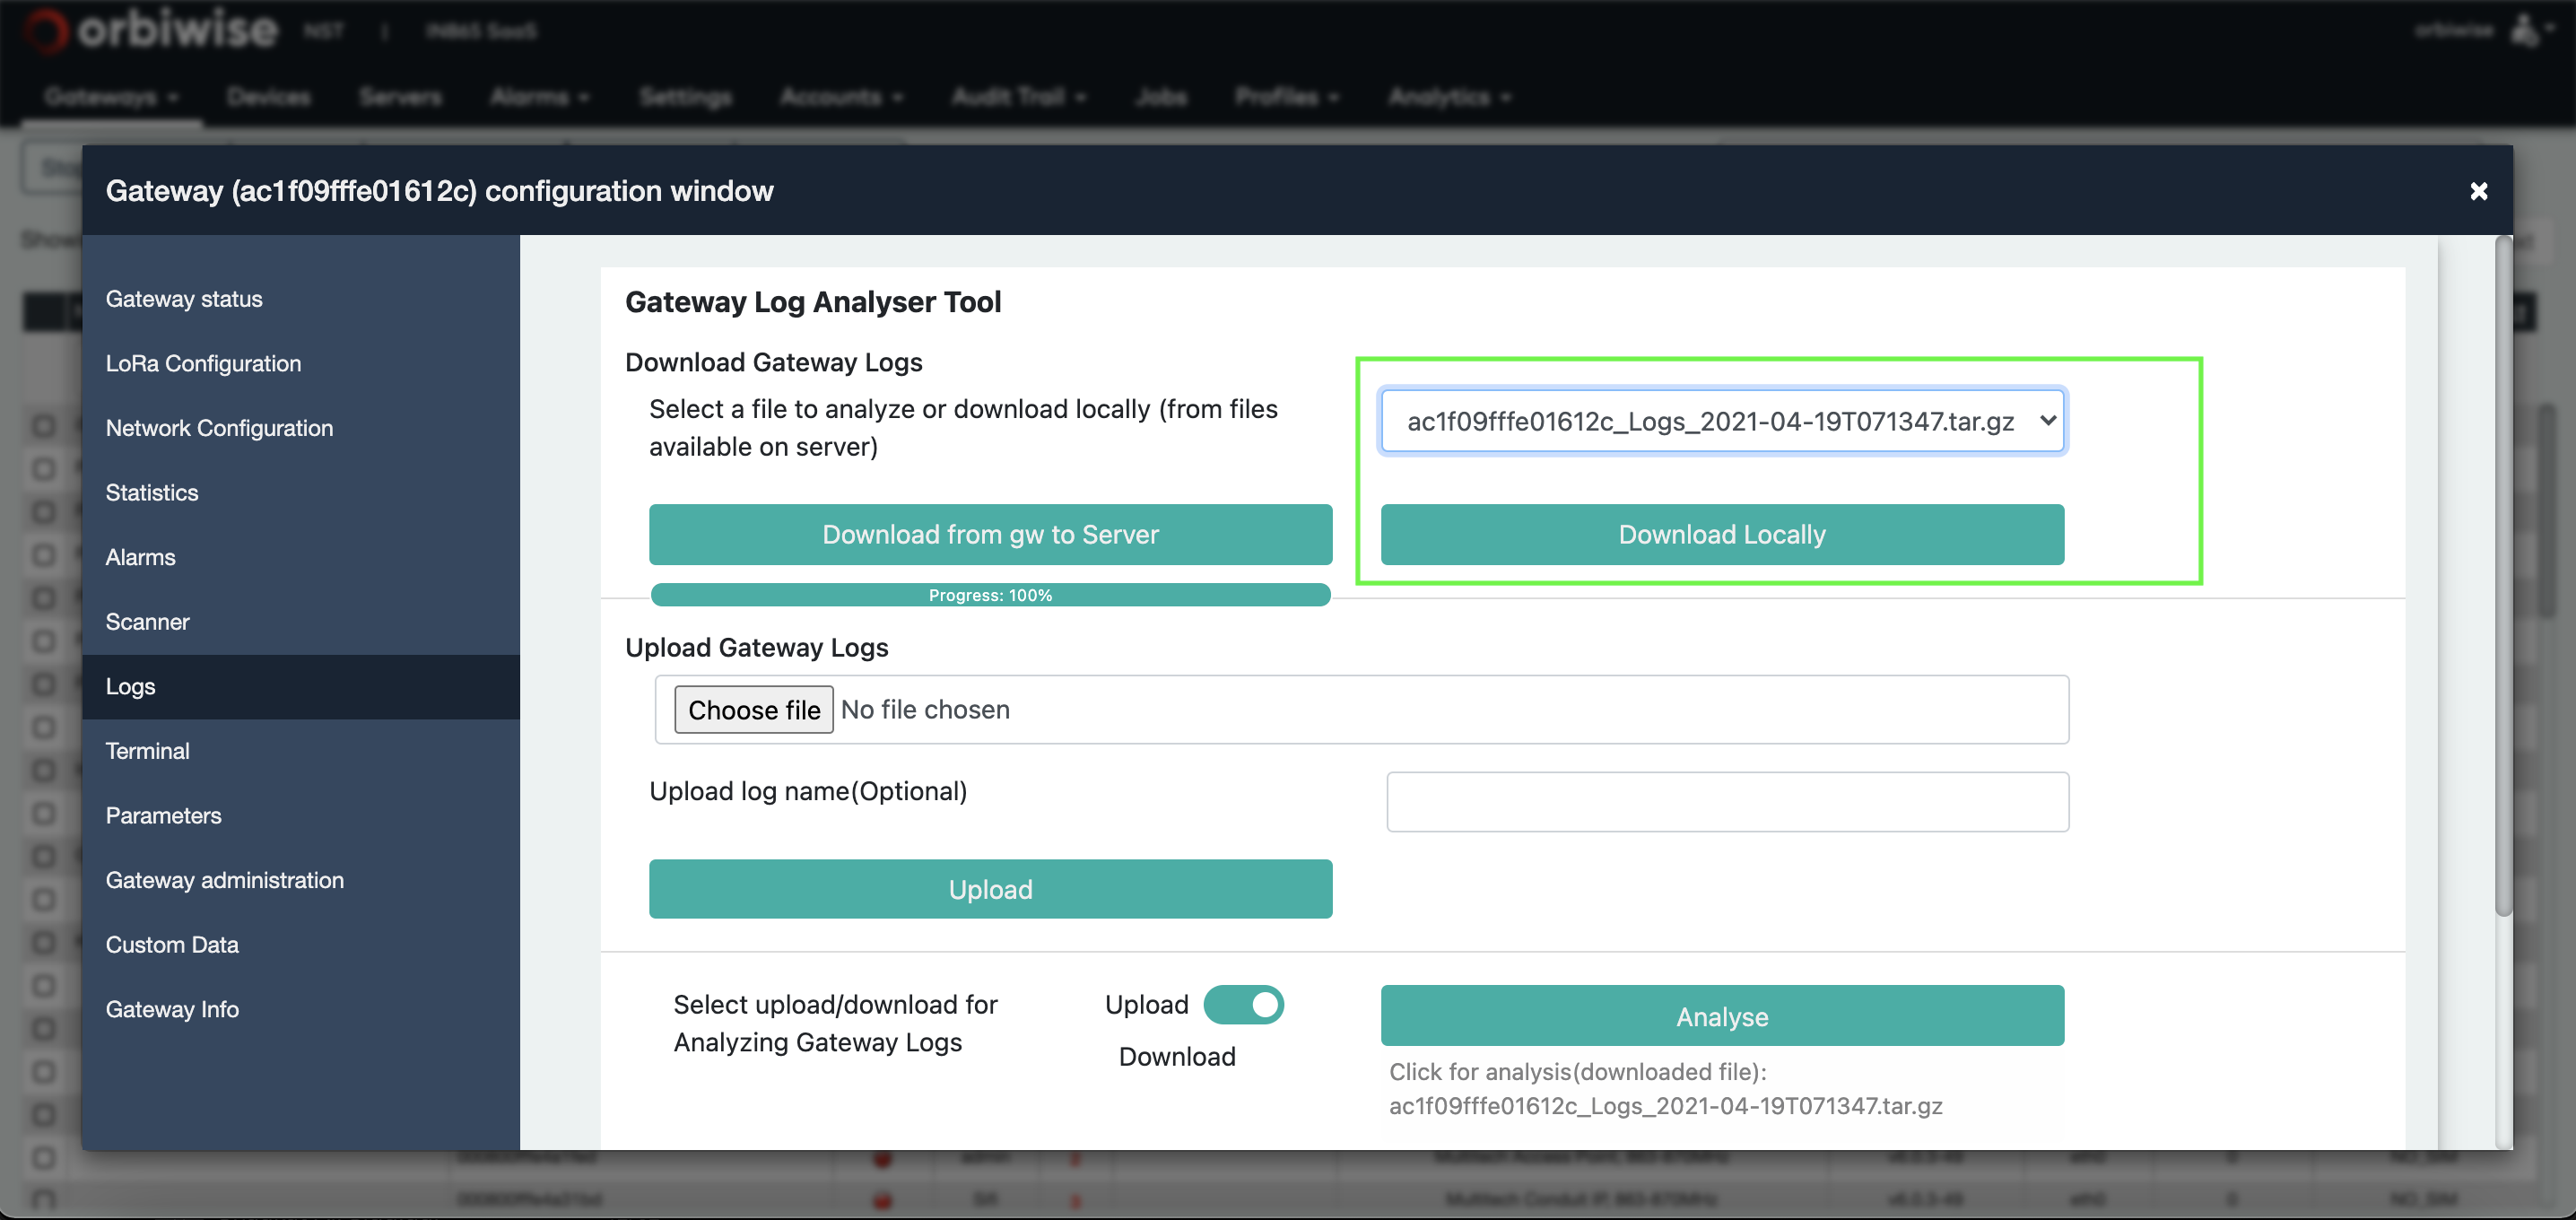
Then it is possible to download it locally by pressing the Download Locally button.
By clicking Analyse button, the log file will be analysed and most current issue of the gateway will be detected.
An example of the same is shown in the figure below:
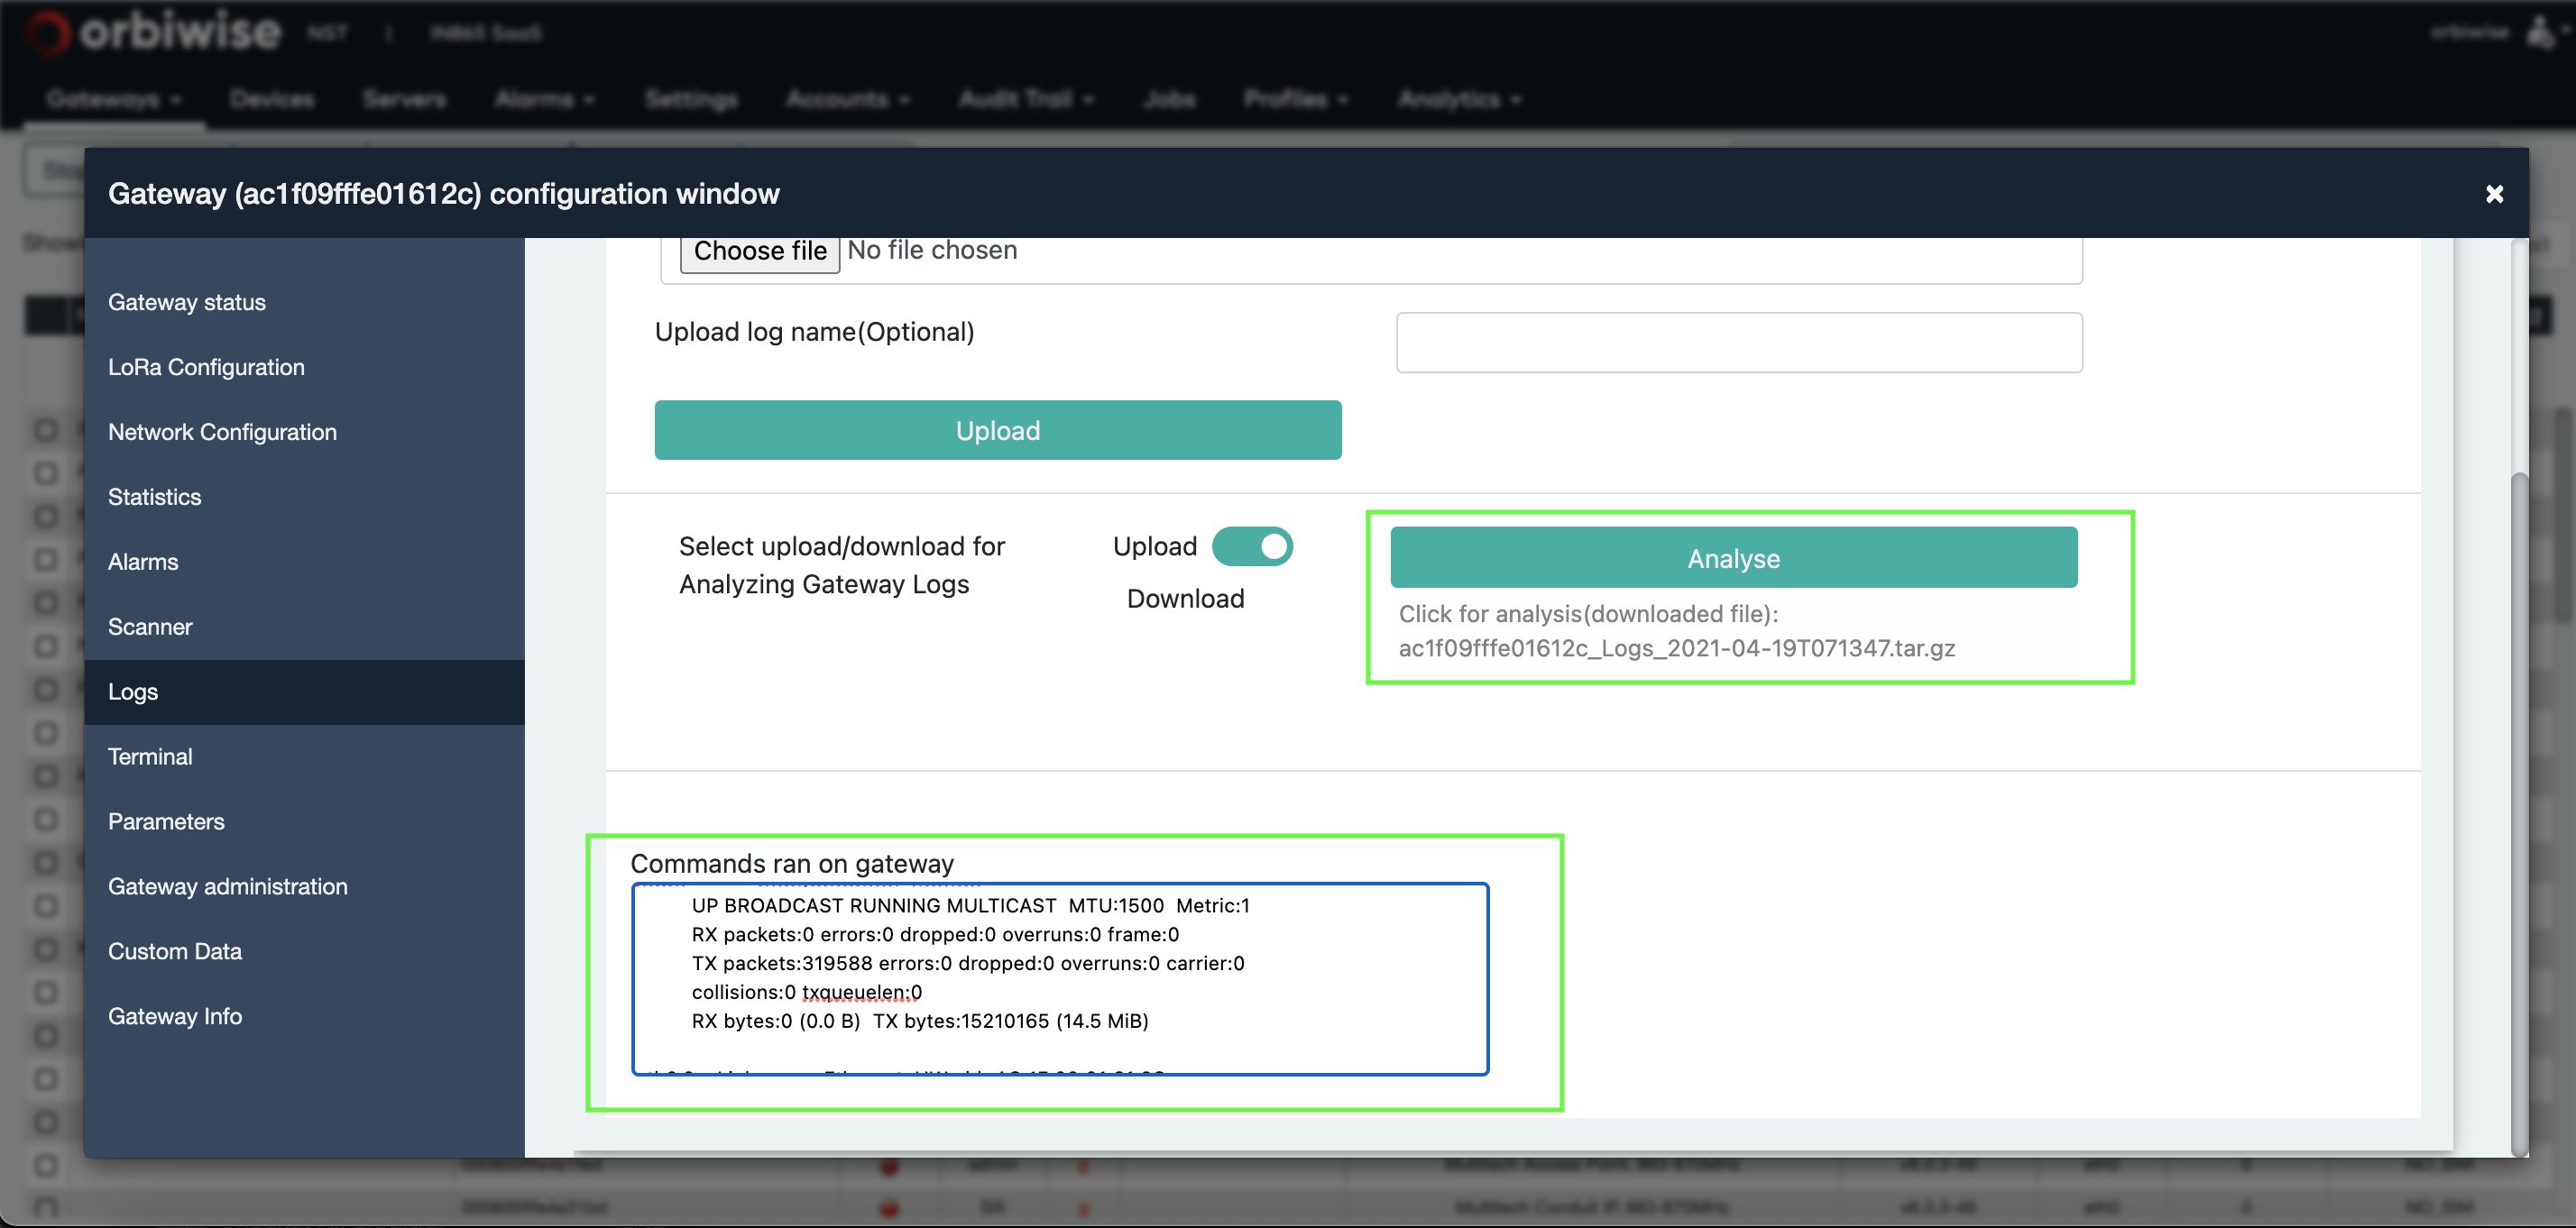
The interface also allows the uploading of a previously locally downloaded log file in order to analyze it again.
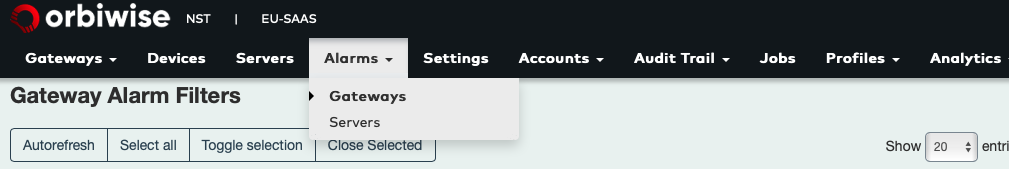
Alarms
Within the OrbiWAN solution, alarms can be raised by or for any components of the system. The Operation and Maintenance Center server manages the alarms.
Alarms that are on going or that have been raised then closed in the past can be displayed within the NST. The alarms tab is sub-divided in Servers alarms and Gateways alarms as shown in the figure below.
These tabs give access to the on going alarms but also to the alarm history.
Note that the OMC server implements a SNMP interface, allowing the sending of a trap message at anytime an alarm is raised to a distant server. The MIB file for the interface is available for quick integration with a distant server.
Each alarm contains the following fields:
- The ID of the server (gateway for gateway view) that is related to the alarm. The ID identifying the server is made of the server type plus the local IP address of the VM on which the server is running.
- For gateway alarm view only, the gateway name.
- The device type that can be GTW or the name of the server.
- The alarm type that describes the alarm.
- The status of the alarm.
- The start date of the alarm.
- The end date of the alarm.
- A button to edit the alarm.
The color of the alarm frame is dependent of the alarm severity. Currently 3 severities are used in the system:
- Yellow for warning.
- Orange for minor alarm.
- Red for major alarm. Most of the alarms close themselves automatically. For example, if a gateway power supply alarm is raised, the alarm will be automatically closed whenever the gateway power supply is restored.
Most of the alarms close themselves automatically. For example, if a gateway power supply alarm is raised, the alarm will be automatically closed whenever the gateway power supply is restored.
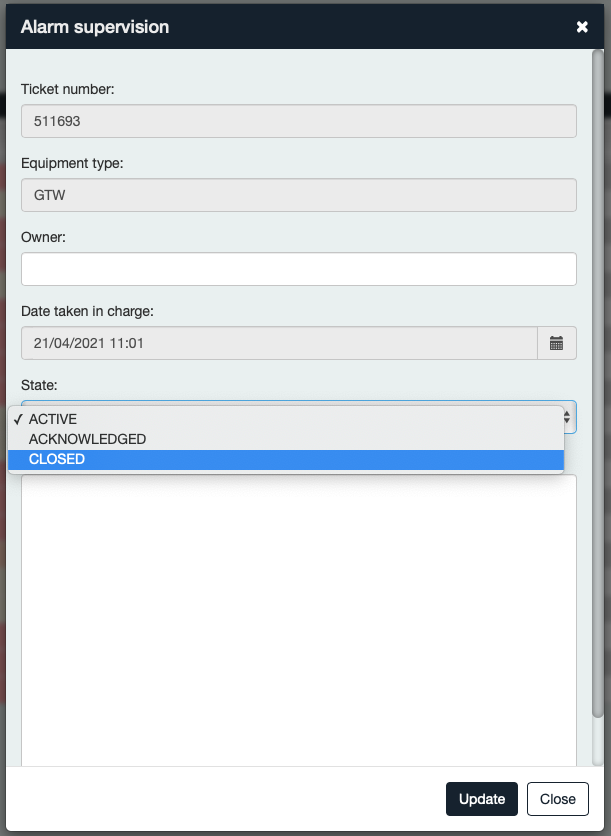
For the others, they need to be closed manually. For this, click on the button to edit the alarm. A pop-up will appear (see Figure 68), change the state to Closed, and then the alarm is marked as closed. It will disappear from on going alarm list.
Alarms are kept in a database for a number of days that is configurable.
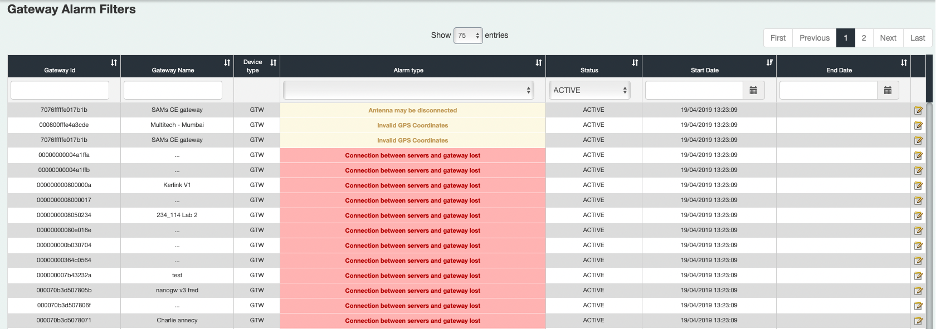
Gateway alarms
The figure below shows Active gateway alarms view
Table below lists the different gateway alarms that can be raised with the severity of the alarm, whether it is automatically closed of not, plus some comments for each alarm.
| Alarm | Severity | Auto closed | Comment |
|---|---|---|---|
| Reboot | Warning | Yes | The reboot alarm is closed 5 minutes after being raised. It is more of an indication. It is raised at the time the gateway has rebooted. |
| Battery low level | Minor | Yes | The battery low-level alarm can be used with gateways that are solar powered. The alarm is raised when the voltage falls below a predefined threshold. This alarm can only be raised with gateways that provide their supply voltage (Kerlink V1 and V2 gateways are compatible). |
| Power failure | Major | Yes | The alarm is raised when the gateway detects that there is no power supply and has a backup battery giving some time to send the alarm (only Kerlink V1 and V2 gateways). |
| Shutdown | Major | Yes | After a power failure or when the battery level is low, the firmware can decide to shutdown the battery and the alarm will be raised. This alarm is raised by the gateway, so it may be on whereas other alarms raised by the servers might still have not raised. |
| Backhaul connection loss | Major | Yes | This alarm is raised when the UDP keep alive to the OMC server is not functional anymore. The alarm is raised when no keep alive has been received by the Omserver for more than 100s. Note that since this alarm is detected by servers, its raising will be delayed compared to Shutdown alarm that is raised by the gateway. |
| LoRa radio is off | Major | Yes/No | The alarm can be raised when: The LoRa radio configuration provided to the gateway is not correct. The alarm will not be closed automatically except if a valid configuration is provided to the gateway.The gateway is running a standard scan and the reception of real-time traffic is not possible. The alarm will be automatically closed at the end of the scan. |
| NetServer keep alive not functional | Major | Yes | This alarm is raised when the Netserver is not able to ping the gateway anymore.The alarm is raised when there has not been any successful ping to the gateway since more than 100s.Note that since this alarm is detected by servers, its raising will be delayed compared to Shutdown alarm that is raised by the gateway itself. |
| Antenna may be disconnected | Warning | Yes | This alarm is raised when the LoRa antenna is disconnected and it is raised at boot time. The alarm will be closed at boot time when the antenna has been reconnected (Only Kerlink V2). |
| Invalid GPS coordinates | Warning | Yes | The alarm is raised when the GPS lock has been lost for more than 1 minute. |
| Door is Open | Warning | Yes | This alarm is raised when the door is open (Only Kerlink V2). |
| Secondary backhaul down | Minor | Yes | This alarm is used when the gateway starts to use the secondary backhaul. |
| Invalid Calibration Data | Major | Yes | This alarm is raised by the gateway when the calibration data is not valid. |
| Modem X down | Warning | Yes | The alarm is raised when one modem is not available (Kerlink V2 with dual cellular modem only). |
| Low disk space | Minor | Yes | The alarm is raised in case of high memory usage. |
| Invalid Calibration Data | Major | Yes | This alarm is raised by the gateway when the calibration data is not valid. |
| Low disk space | Minor | Yes | The alarm is raised when the disk space on the gateway is low. |
| High temperature | Minor | Yes | The alarm is raised in case of high temperature (Kerlink V1, V2, Tektelic and Multitech) |
Server alarms
The Table below lists the different functional server and virtual machine alarms, that can be raised, with the severity of the alarm, whether it is automatically closed of not, plus some comments for each alarm.
| Alarm | Severity | Auto closed | Comment |
|---|---|---|---|
| Server unreachable by OMC server | Major | Yes | The OMC server is checking the health of all the servers of the instance regularly. Whenever one server has not answering to this periodic check during a period of time, the alarm is raised. Whenever the server answers again, the alarm is automatically closed. |
| CPU load is high | Minor | Yes | This alarm is raised when the CPU load used by a server is reported as high during a pre-defined period of time. The CPU high-level detection threshold can be changed.The alarm is automatically closed when the CPU load falls below the threshold. |
| CPU load is too high | Major | Yes | This alarm is raised when the CPU load used by a server is reported as too high during a pre- defined period of time. The CPU too high-level detection threshold can be changed. The alarm is automatically closed when CPU load falls below the threshold. |
| Heap size used high | Minor | Yes | This alarm is raised when the size of the heap size used by the server reaches a threshold for a pre-defined period of time. The threshold is configurable . The alarm is automatically closed when the heap size falls below the threshold. |
| Heap size used too high | Major | Yes | This alarm is raised when the heap size used by the server reaches the threshold “heap size too high” for a pre-defined period of time. The threshold is configurable. The alarm is automatically closed when heap size falls below the threshold. |
| Max threads exceeded. OMC server restarted | Major | No | This alarm is raised whenever the number of threads in the OMC server is growing abnormally. The OMC server in this case will restart automatically. The alarm is not closed automatically, it is likely logs need to be check to understand the reason for the high number of threads. |
| VM unreachable by OMC server | Major | Yes | The OMC server is checking the health of all the virtual machines of the instance regularly.Whenever one VM has not answered to this periodic check during a pre-defined period of time, the alarm is raised. Whenever the VM answers again, the alarm is automatically closed. |
| VM average load is high | Minor | Yes | The OMC server checks the average load of all the VMs periodically. Whenever the average load exceeds the “ high” threshold (configurable on the NST) during a predefined period of time, the alarm is raised. The alarm is closed as soon as the average load falls below the threshold. |
| VM average load is too high | Major | Yes | The OMC server checks the average load of all the VMs periodically. Whenever the average load exceeds the “too high” threshold (configurable on the NST) during a predefined period of time, the alarm is raised. The alarm is closed as soon as the average load falls below the threshold. |
| VM memory used is high | Minor | Yes | The OMC server checks the used memory of all the VMs periodically. Whenever the used memory exceeds a “high” threshold (configurable on the NST),the alarm is raised. The alarm is automatically closed, when the used memory falls below the threshold. |
| VM memory used is too high | Major | Yes | The OMC server checks the used memory of all the VMs periodically. Whenever the used memory exceeds a “too high” threshold configurable on the NST, the alarm is raised. The alarm is automatically closed, when the used memory falls below the threshold. |
| VM disk space low | Minor | Yes | The OMC server checks the remaining disk space of all the VMs periodically. Whenever the remaining disk space falls below a “low” threshold configurable on the NST, the alarm is raised. The alarm is automatically closed when the remaining disk space exceeds the threshold. |
| VM disk space too low | Major | Yes | The OMC server checks the remaining disk space of all the VMs periodically. Whenever the remaining disk space falls below a “too low” threshold configurable on the NST, the alarm is raised. The alarm is automatically closed when the remaining disk space exceeds the threshold. |
| NetServer errorlog | Minor | No | Whenever an unexpected event happens on a server, this event is traced in an errorlog file. In order to be notified of the event, an alarm is raised when the file grows in size. This alarm needs to be manually closed. |
| Number of PostGreSQL connection high | Minor | Yes | Whenever the number of connections to the PostGreSQL database exceeds a threshold that can be set on the NST (refer to section 9.4), an alarm is raised. The alarm is automatically cleared whenever the number of connections to the database falls below the threshold. |
| NetServer max number of UL threads reached. Server restarted. | Major | No | This alarm is raised whenever the number of UL threads in the network server is growing abnormally. The network server in this case will restart automatically. The alarm is not closed automatically at it is likely logs needs to be checked to understand the reason for the high number of threads. |
| NetServer max number of DL threads reached. Server restarted | Major | No | This alarm is raised whenever the number of DL threads in the network server is growing abnormally. The network server in this case will restart automatically. The alarm is not closed automatically as it is likely logs need to be checked to understand the reason for the high number of threads. |
| Server was unreachable by OMC and has been successfully restarted | Major | No | Whenever the network server or the DASS server is not answering to the periodic check performed by the OMC server during a pre-defined period of time, the OMC server will try to restart the failing server. In case of a successful restart of the server, the alarm is raised. If not, the alarm is not raised but the “Server unreachable by OMC server” alarm will be raised. This alarm needs to be cleared manually. |
| No Cassandra host available reported by network server | Major | Yes | Whenever the Network Server is unable to reach any Cassandra database nodes, it will raise this alarm. The alarm is closed automatically whenever the Cassandra nodes become available again. |
Parameters
The parameters tab of the gateway configuration window allows users to modify some gateway configuration parameters default values.
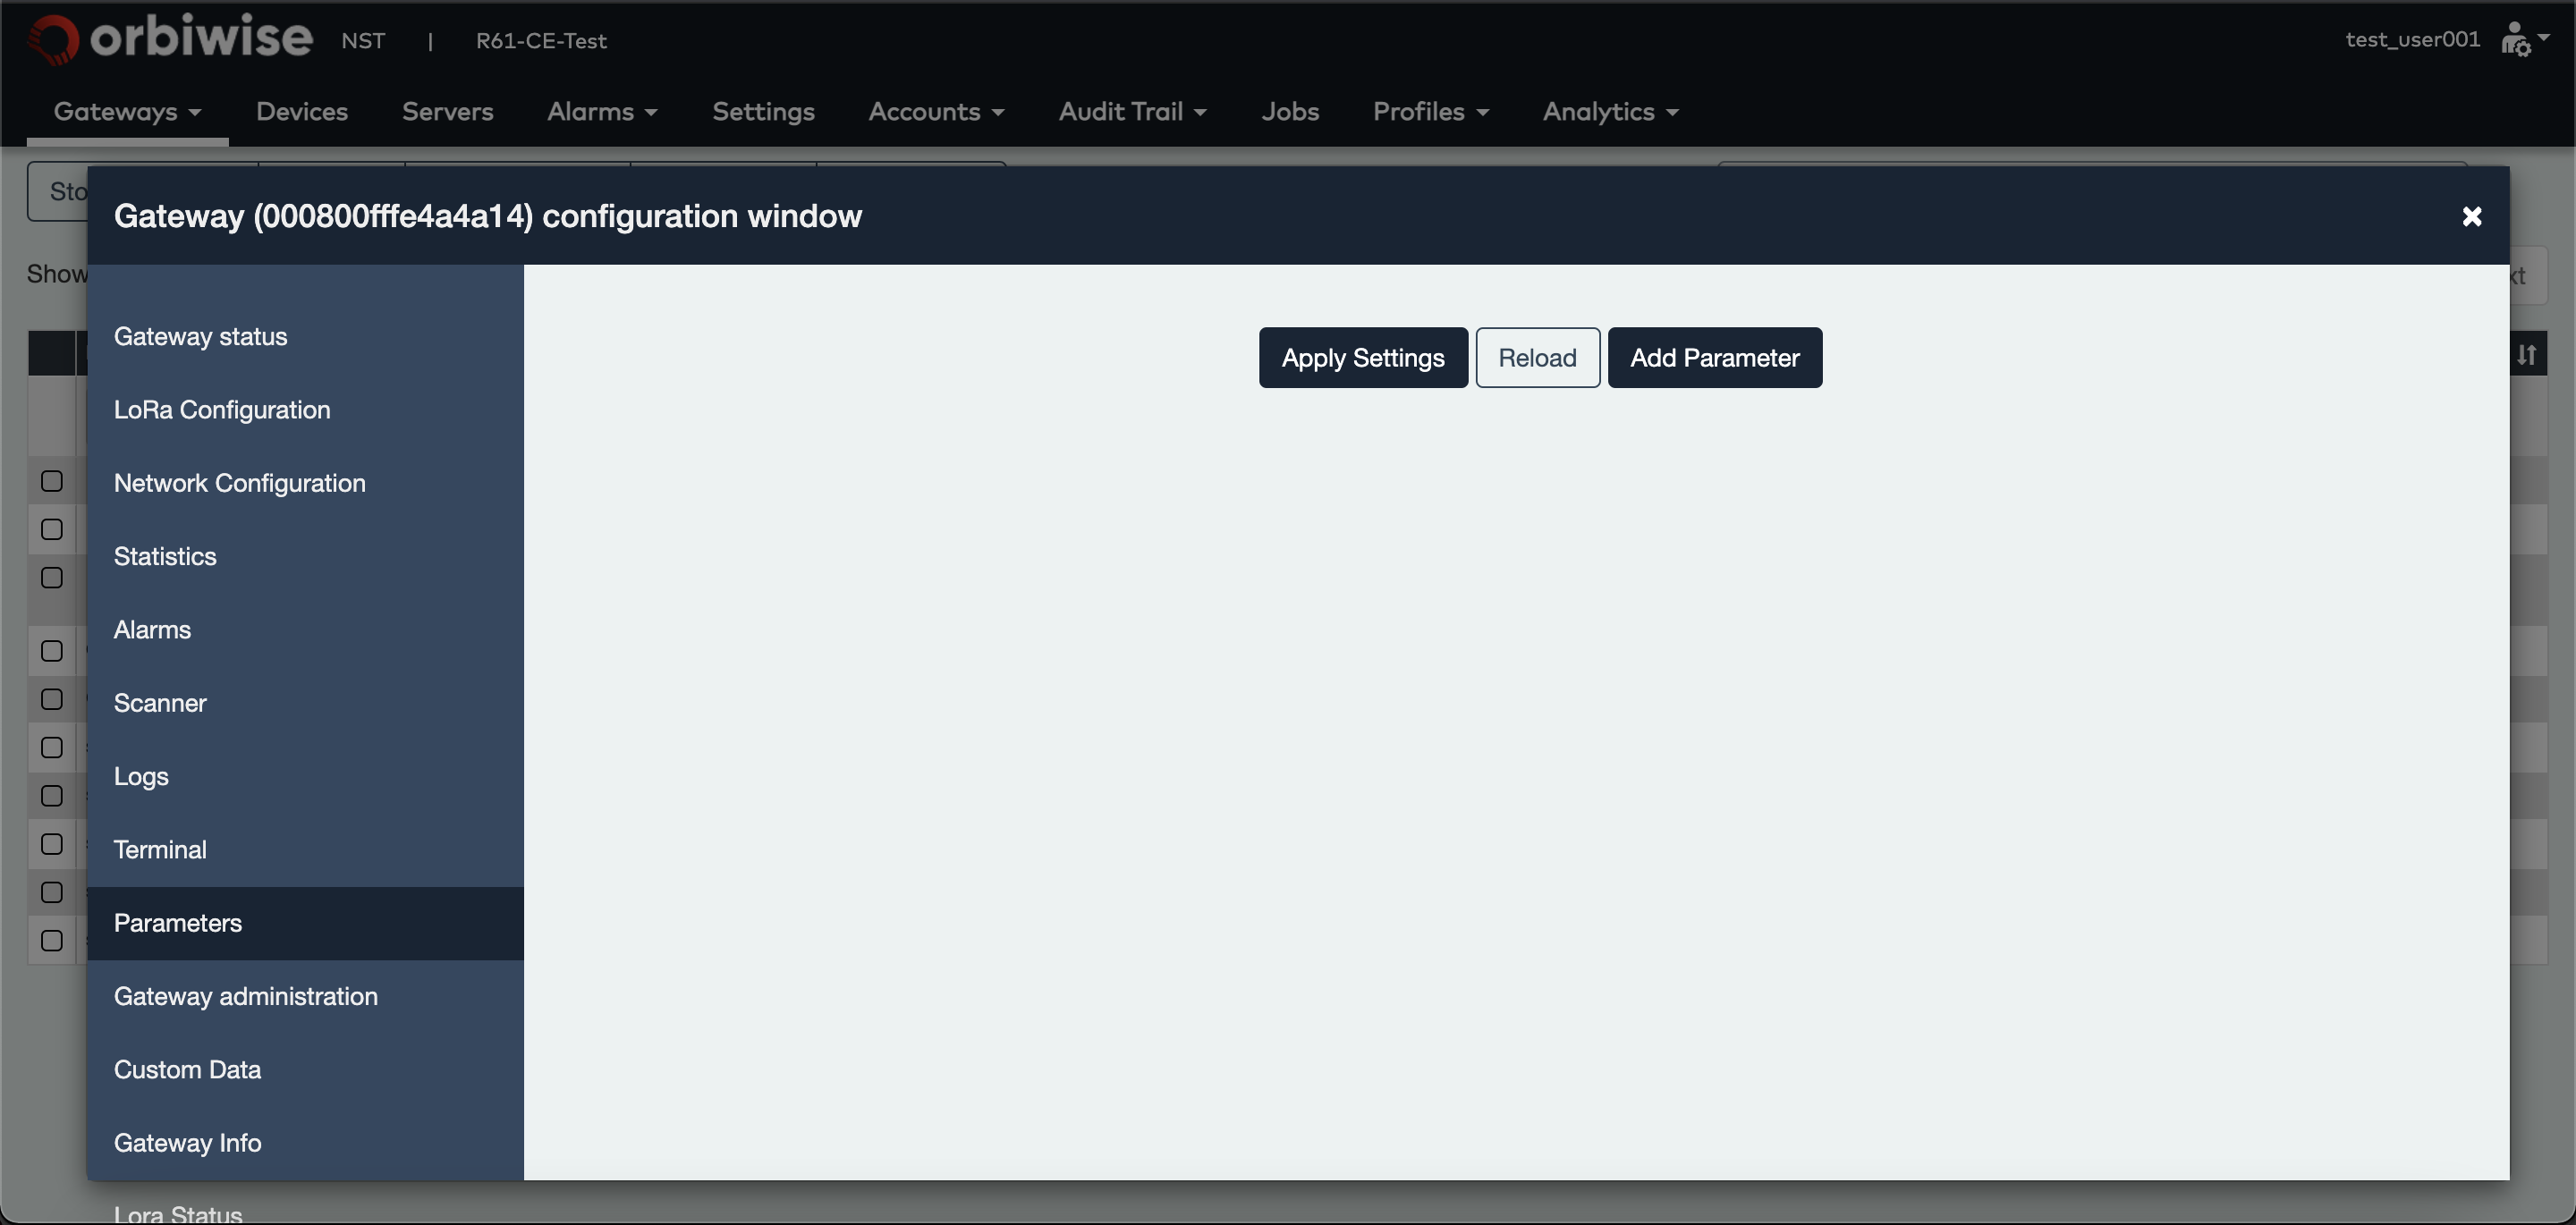
Table below shows some of the gateway configuration parameters for which the default value can be changed through this interface.
| Parameter Key | Value | Usage |
|---|---|---|
| scan_fmin | In Hz | Scanner Lower Band frequency |
| scan_fmax | In Hz | Scanner Upper Band frequency |
| scan_fstep | In Hz | Scanner frequency step |
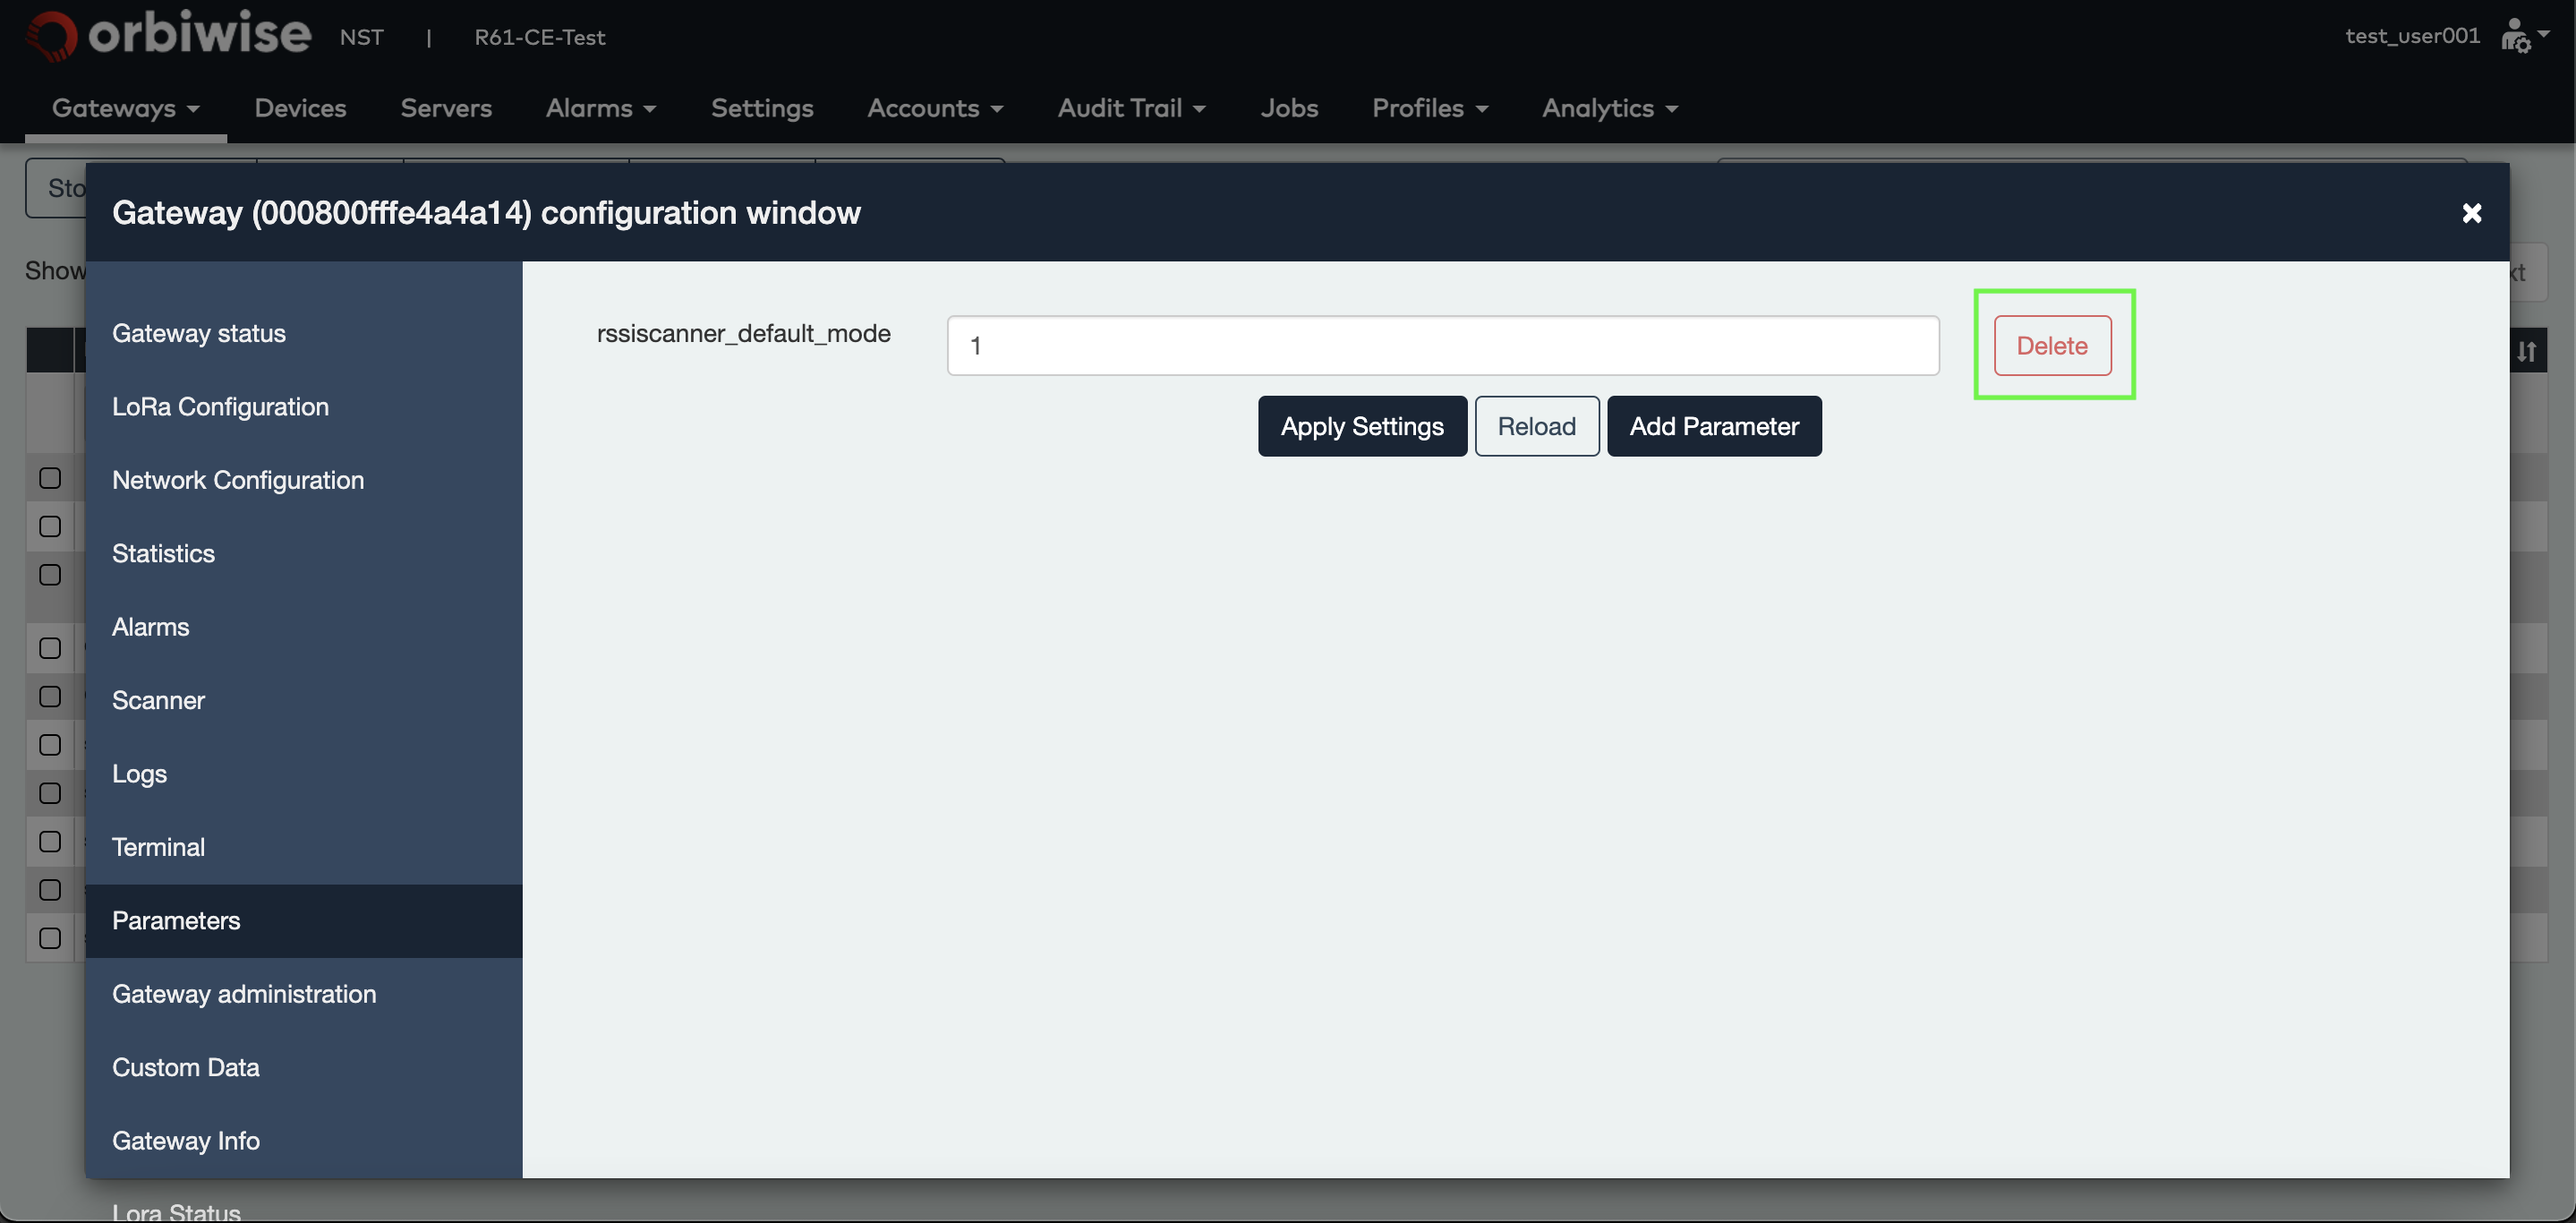
| rssiscanner_default_mode | 0/1 | 0 indicates standard mode, 1 is used for parallel mode |
| start_rssiscanner_cmd | Example for US/JP util_rssi_histogram –n 1 – fmin 920000000 –fmax 924000000 | Modify command used for standard scanner start |
| start_parallel_rssiscanne r_cmd | Example for Kerlink V2 /EU ./spectral_scan –d /dev/slot/2/spidev0 –f 863:0.05:870 | Modify command used for parallel scanner start |
| beacon_utc_to_gps | In ms | Compensation timestamp value used to convert from utc time to gps. Used for beacon management |
| primary_interface | Name of interface | Used to change the primary interface in the gateway |
In order to change one default parameter value, the user clicks on Add Parameter button. This will show a dialog box as shown in the figure below:
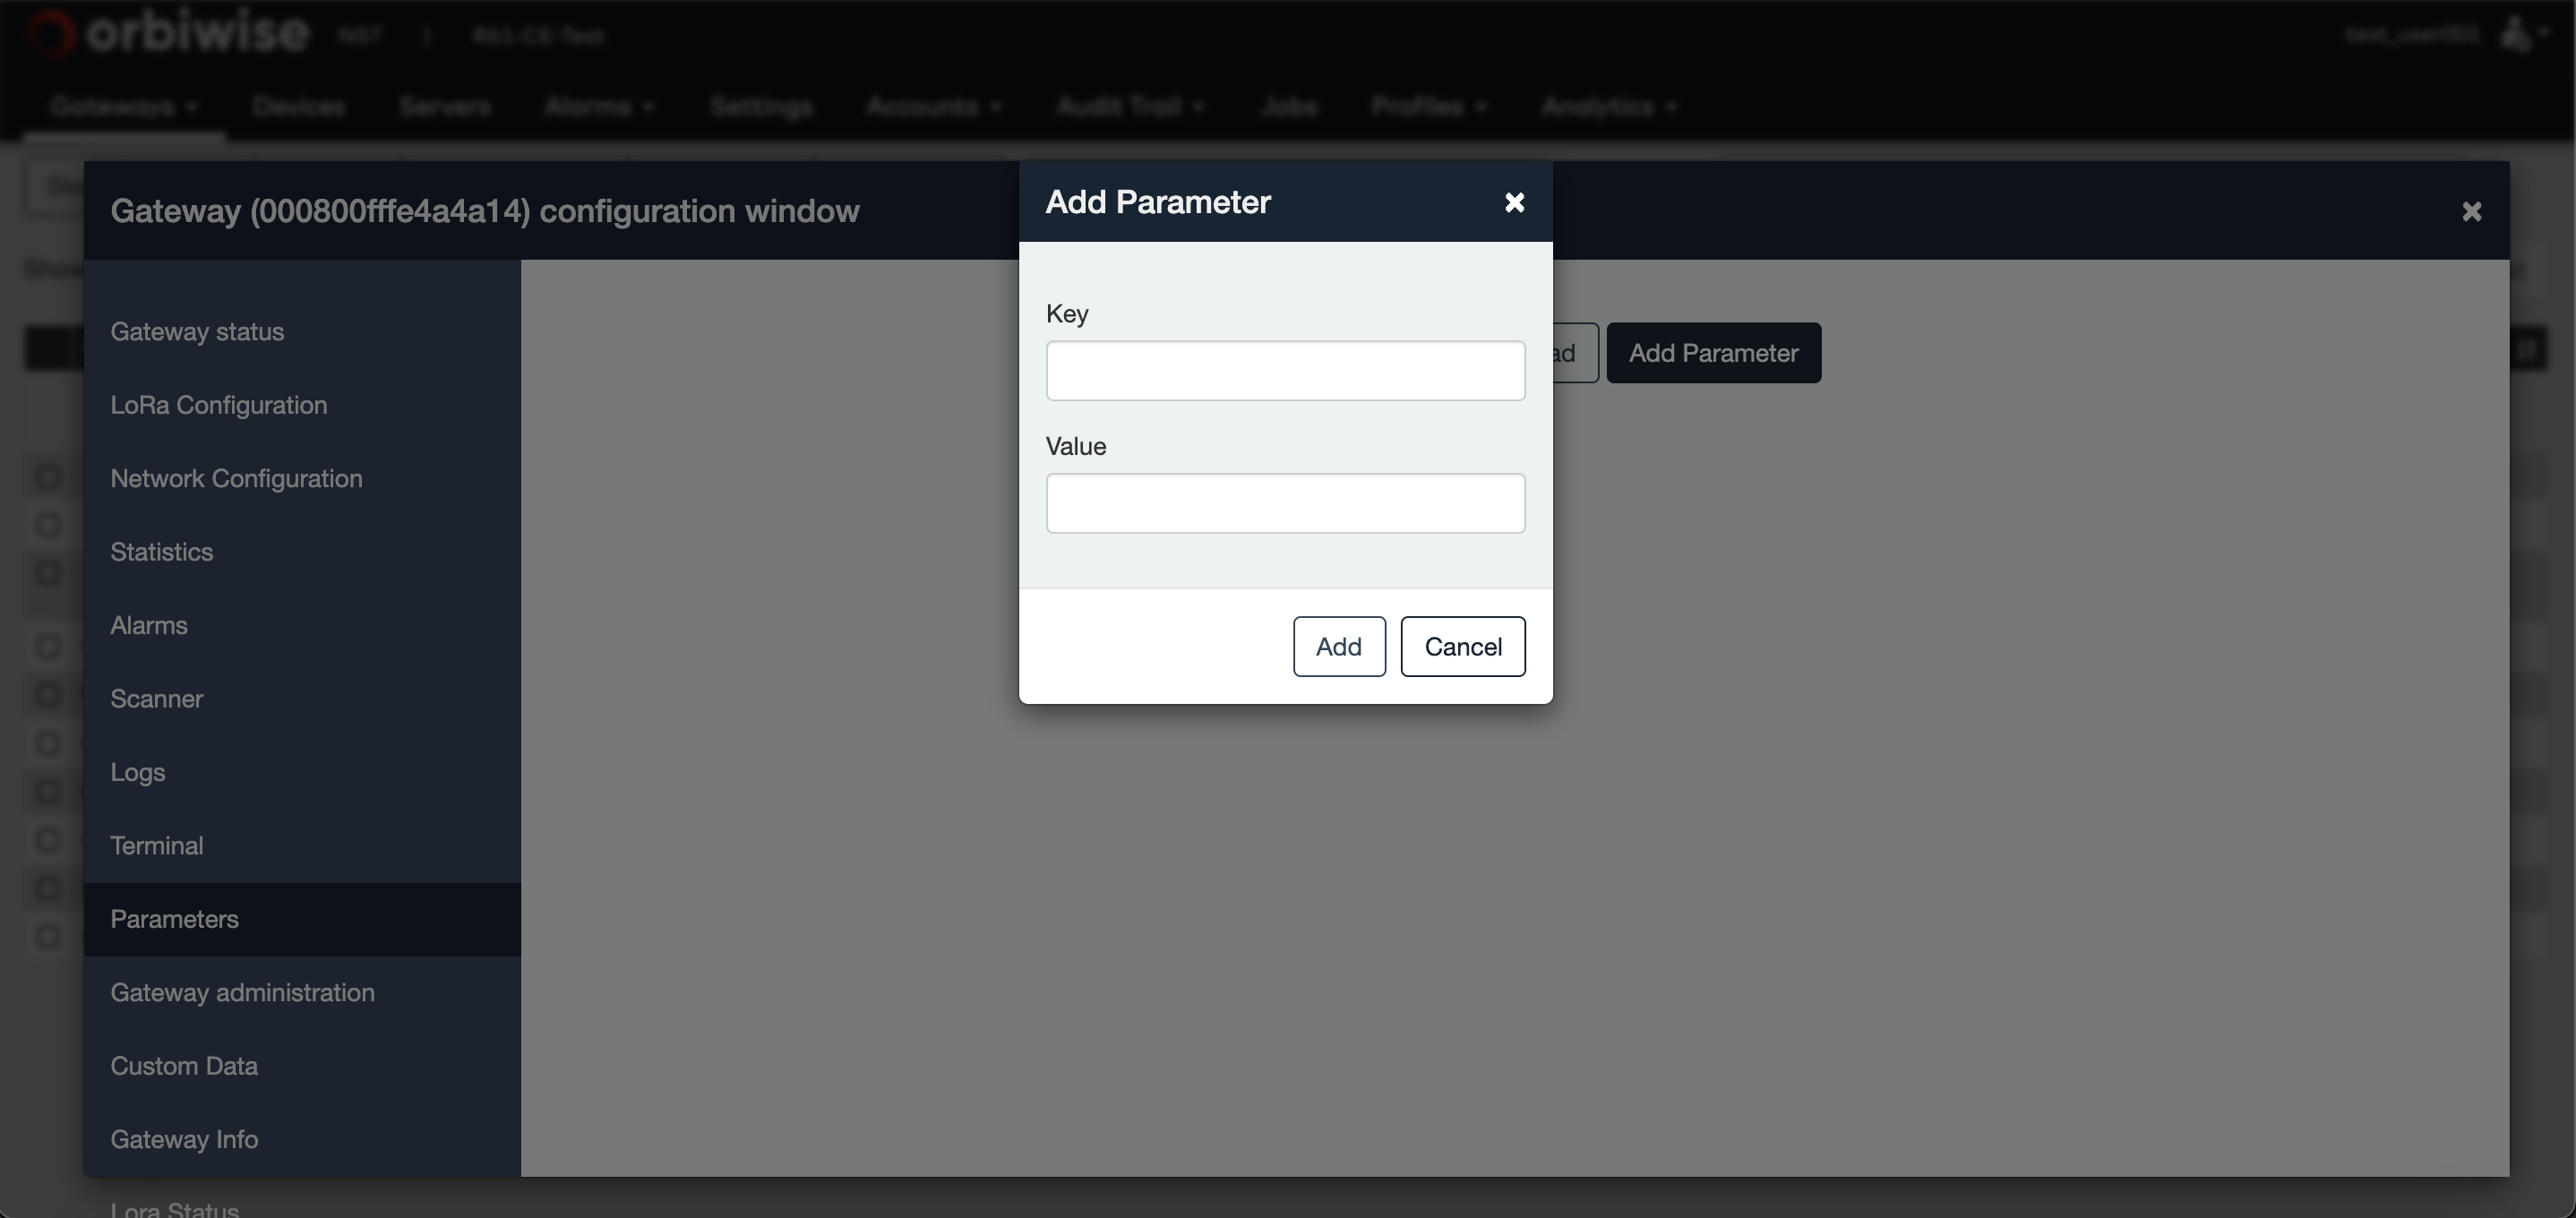
Enter the Key of the parameter to be changed and Walue, then press the Add button.
The new parameter will be displayed in the parameters tab frame as shown in the figure below:
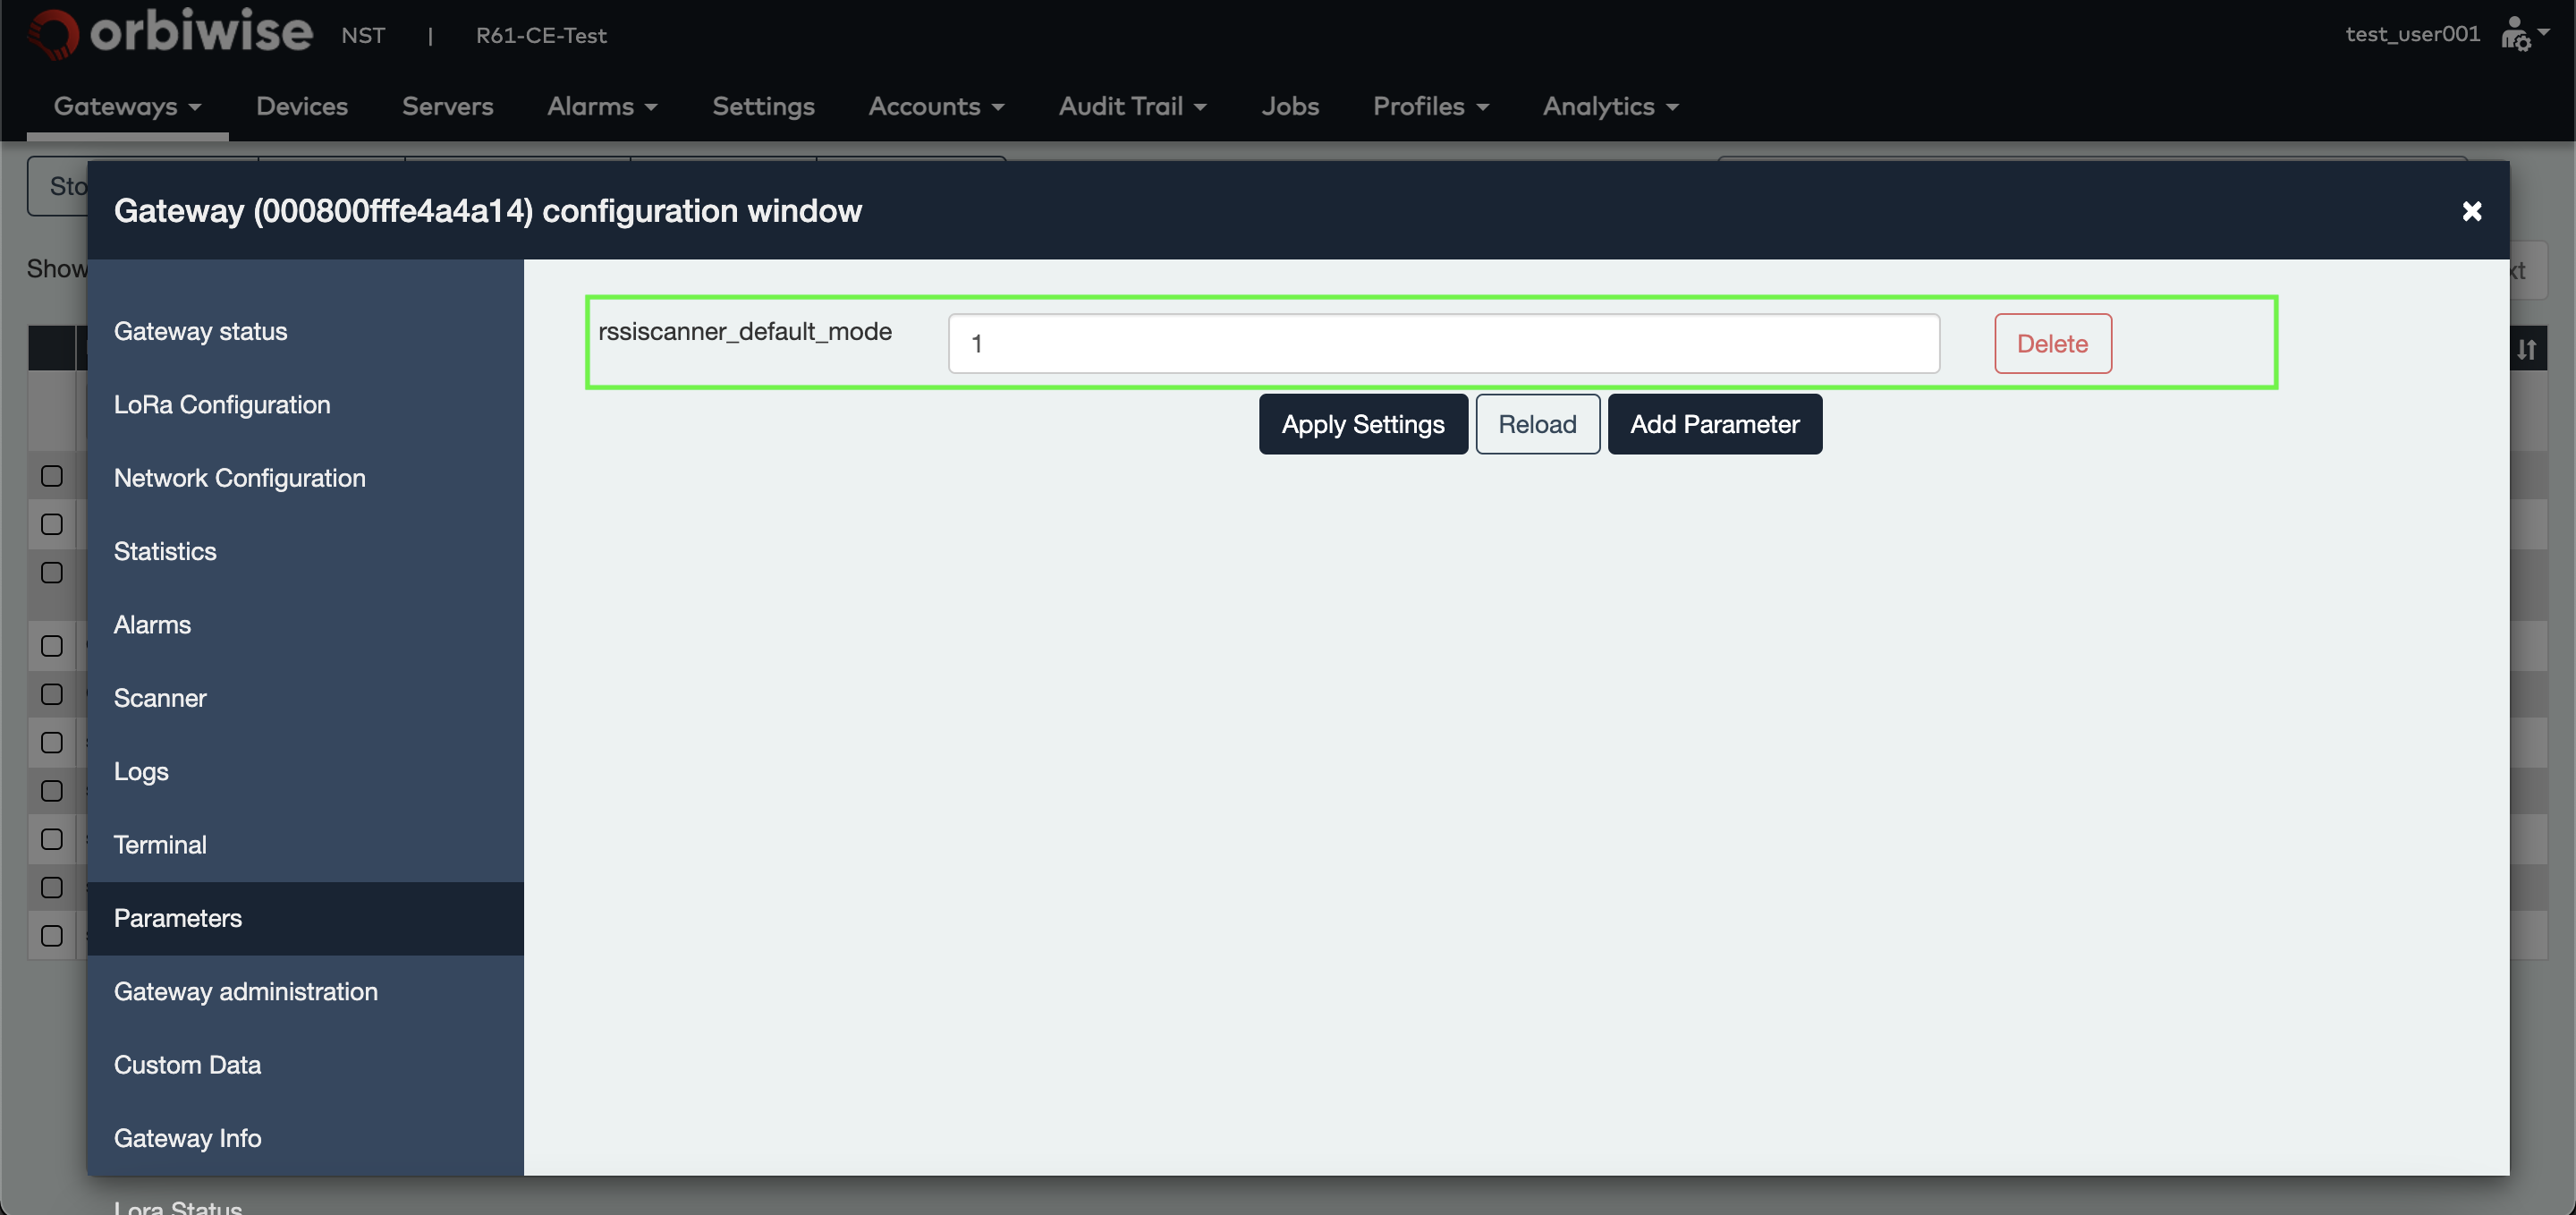
At this stage, the parameter is stored in the database, but it is still not known by the gateway. In order to have the gateway taking account of this parameter, Click on the Apply settings & start/re- start LoRa radio button of the LoRa Configuration tab.
After this, the values will be applied by the gateway.
A parameter can be deleted later by clicking the Delete button on the right side of the parameter.
In order to have the gateway taking account of the change, Click on the Apply settings & start/re- start LoRa radio button of the LoRa Configuration tab.
Analytics
From the Analytics tab, user can access the Trace tab:
- Trace tool
- Gateway reports

Trace tool
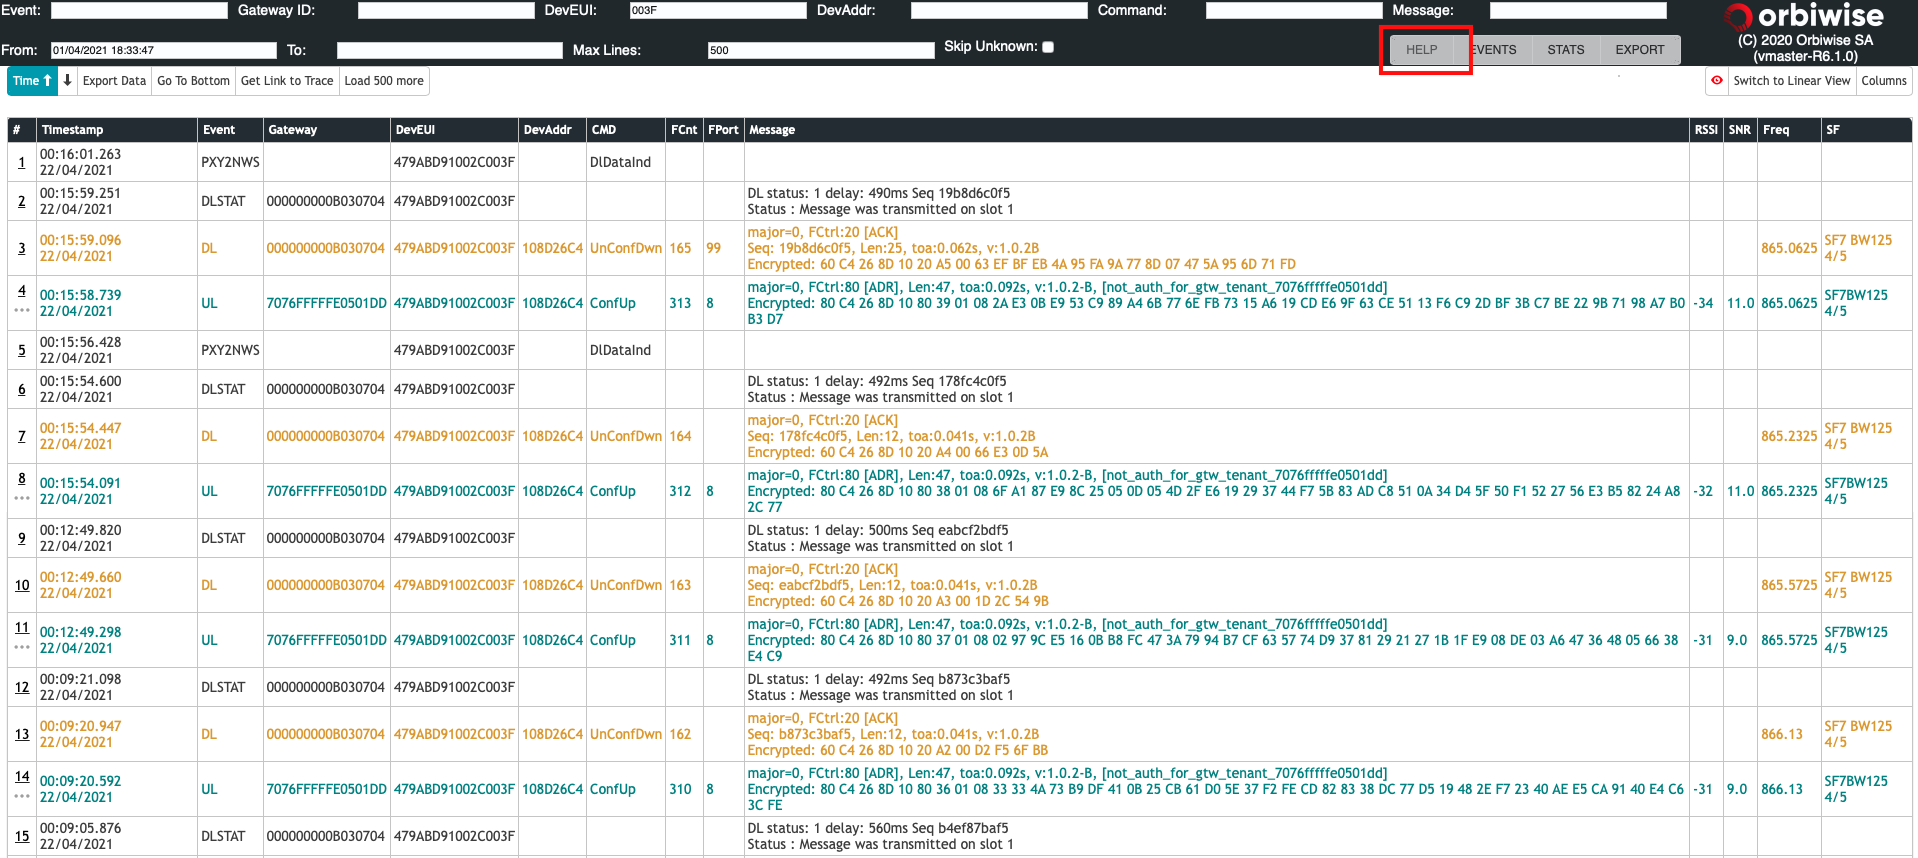
The trace tool is used to view, parse, filter all messages exchanged between devices and gateways. For more information on how to use the trace tool, click on the help button highlighted in Figure below:
Gateway reports
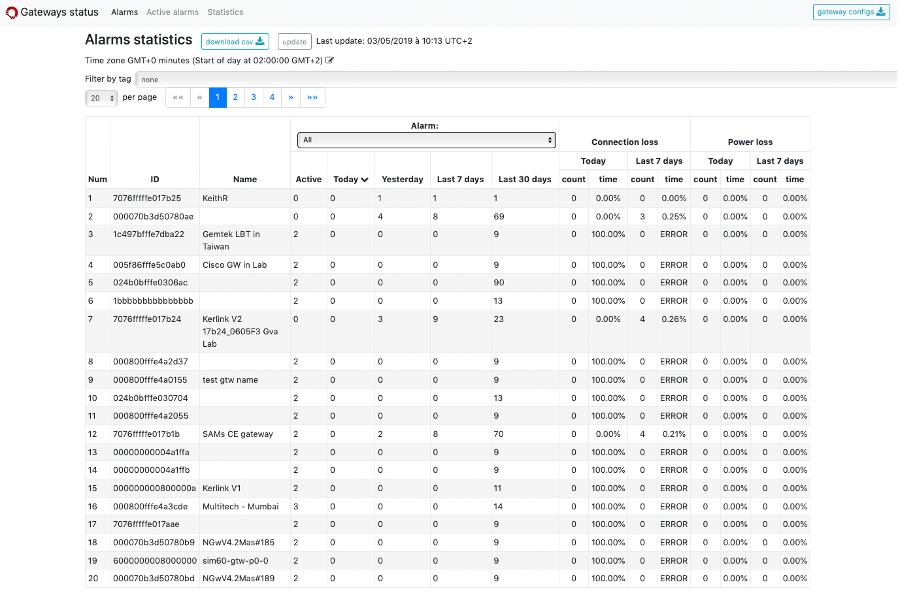
The gateway report tool generates statistics on gateway availability for the current day and the last 7 days. Statistics computed are:
- Availability of gateway supply in %,
- Availability of stable backhaul in %.
Videos
The video consists of the following topics :
- Gateway status
- Network configuration
- Statistics
- Alarms
The video consists of the following topics :
- LoRa configuration
The video consists of the following topics :
- Logs
- Terminal
- Parameters
- Custom Data
- Gateway Info
- Lora Status
- Gateway Administration
- OTA Firmware Upgrade
The video consists of the following topics :
- RSSI Scanner